
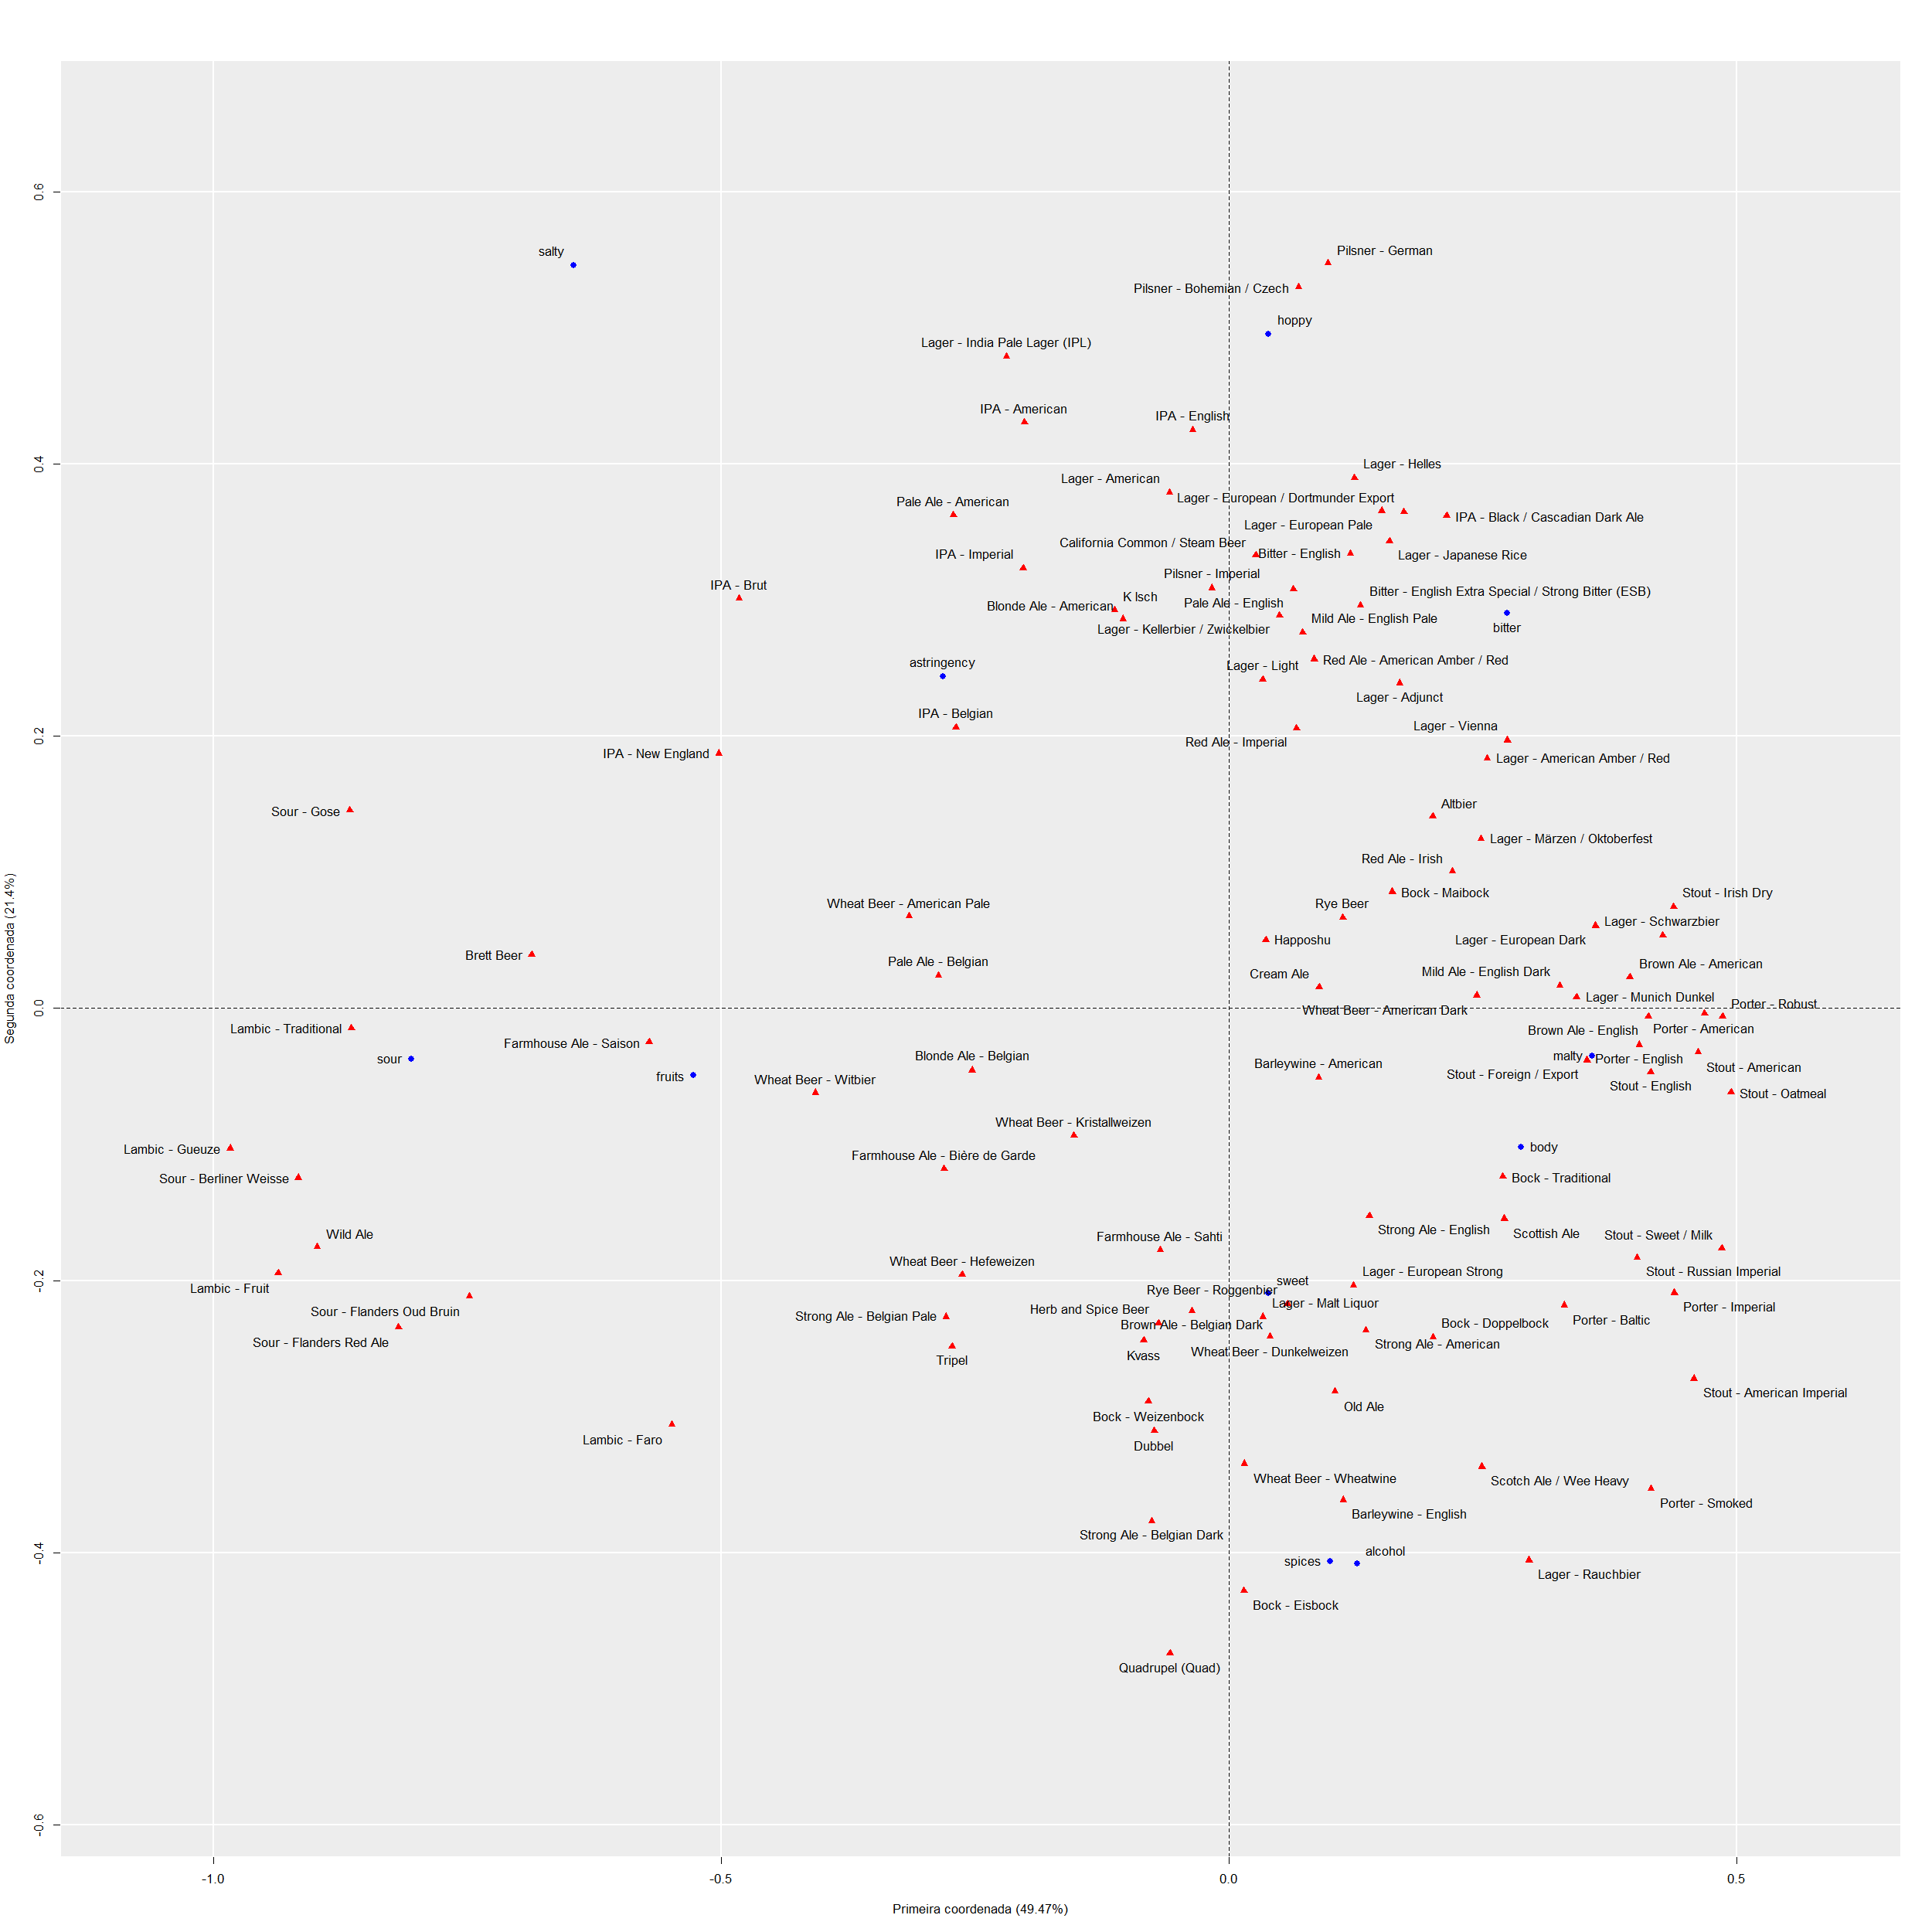
Beer and Taste Perception Map (Correspondence Analysis) – Beers (red) and Taste Perception (blue). Nearby points are similar in taste. [OC] – Made in R using data from BeerAdvocate site.
by medaheg
Beer and Taste Perception Map (Correspondence Analysis) – Beers (red) and Taste Perception (blue). Nearby points are similar in taste. [OC] – Made in R using data from BeerAdvocate site.
by medaheg
2 Comments
Hello, beer lovers!
I am an undergraduate student in Statistics, and for a semester project in my Multivariate Analysis course, I decided to work with a dataset on beer reviews. I used R to code and used webscrapped data from [BeerAdvocate.com](http://BeerAdvocate.com) (a beer review website).
Using correspondence analysis, I created a map that depicts the similarity between beers and their predominant sensory characteristics.
The red triangles represent beer styles, and the blue circles represent taste perceptions. So, for example, if I want to drink a beer with a strong hop characteristic, I look for the blue circle labeled ‘hoppy’ on the map and find different styles around that point that contain this characteristic.
Nearby points tend to have the same taste/feel. So, if you like one style and want to try another similar style, this map would help.
This map contains 103 different beer styles and 11 taste perceptions, which are: Alcohol, Body, Malty, Sweet, Salty, Fruity, Sour, Astringent, Malty, Hoppy, and Spices.
Of course, there may be styles that are not correctly ‘classified’. If you find any, please let me know.
Good work. But what about naming the axis brother?