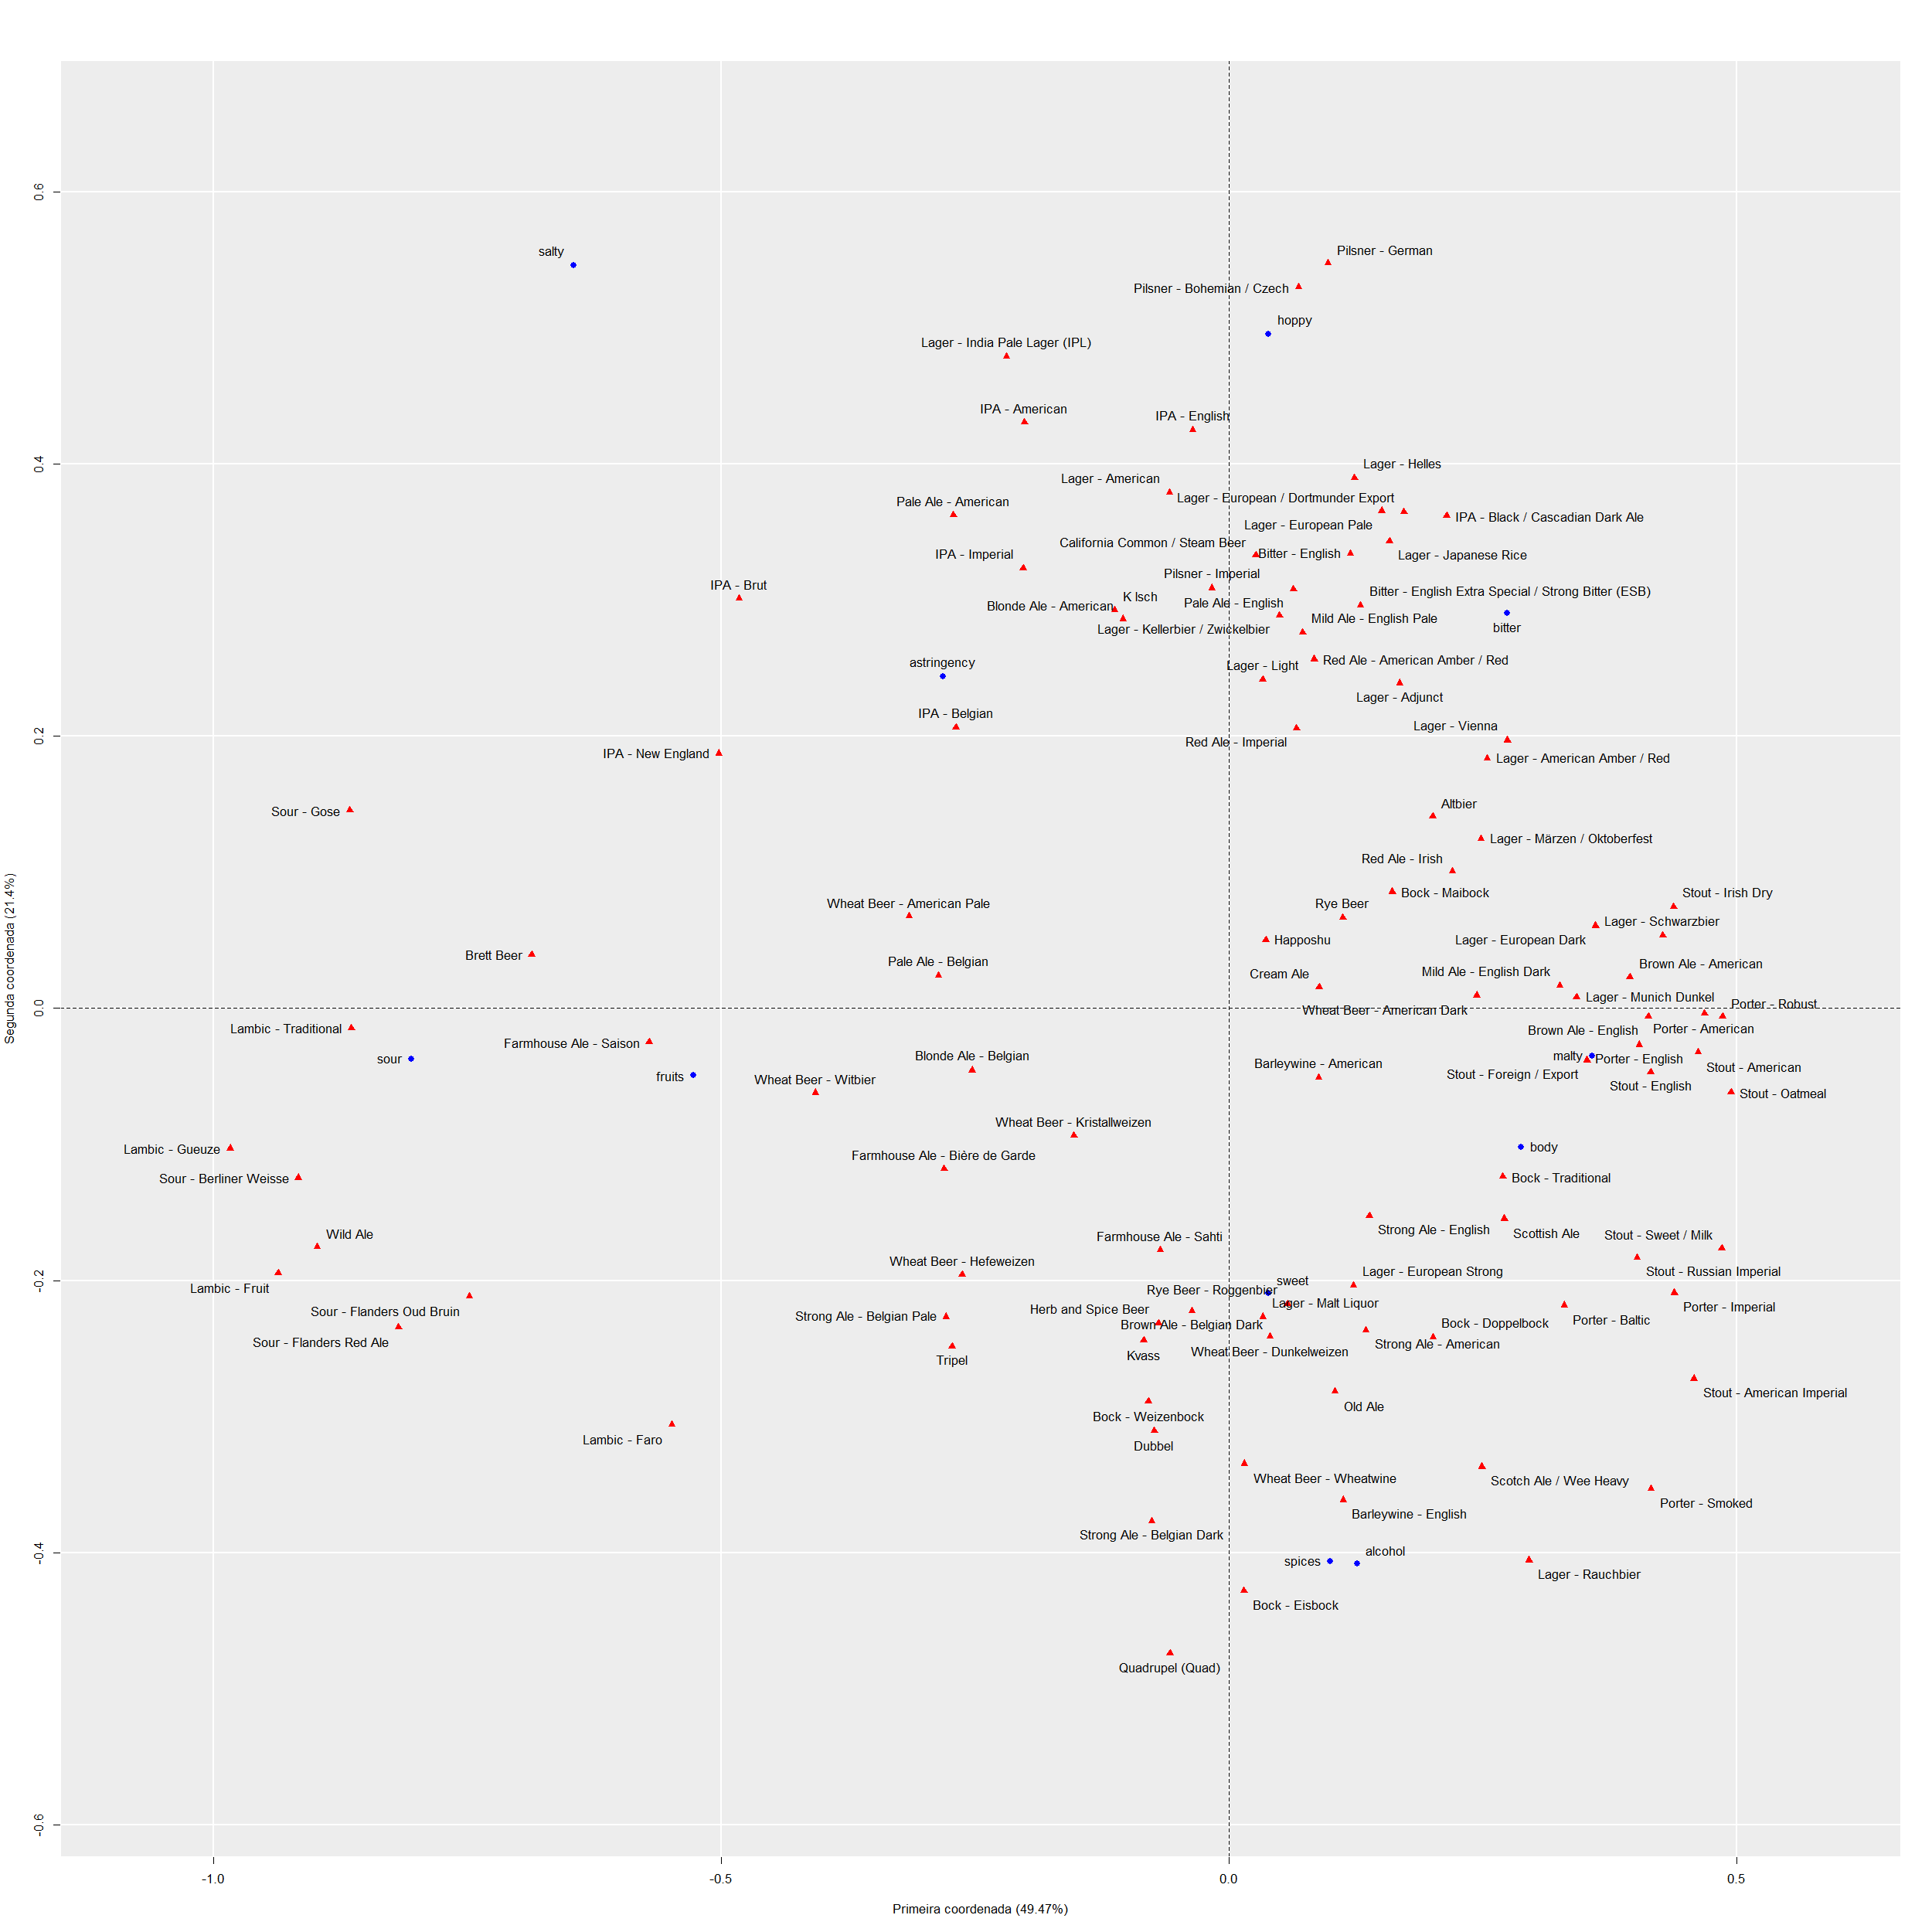
Beer and Taste Perception Map (Correspondence Analysis) – Beers (red) and Taste Perception (blue). Nearby points are similar in taste. [OC] – Made in R using data from BeerAdvocate site.
Beer and Taste Perception Map (Correspondence Analysis) – Beers (red) and Taste Perception (blue). Nearby points are similar in taste. [OC] – Made in R using data from BeerAdvocate site.
I am an undergraduate student in Statistics, and for a semester project in my Multivariate Analysis course, I decided to work with a dataset on beer reviews. I used R to code and used webscrapped data from [BeerAdvocate.com](http://BeerAdvocate.com) (a beer review website).
Using correspondence analysis, I created a map that depicts the similarity between beers and their predominant sensory characteristics.
The red triangles represent beer styles, and the blue circles represent taste perceptions. So, for example, if I want to drink a beer with a strong hop characteristic, I look for the blue circle labeled ‘hoppy’ on the map and find different styles around that point that contain this characteristic.
Nearby points tend to have the same taste/feel. So, if you like one style and want to try another similar style, this map would help.
This map contains 103 different beer styles and 11 taste perceptions, which are: Alcohol, Body, Malty, Sweet, Salty, Fruity, Sour, Astringent, Malty, Hoppy, and Spices.
Of course, there may be styles that are not correctly ‘classified’. If you find any, please let me know.
Tcbcigs on
Good work. But what about naming the axis brother?

2 Comments
Hello, beer lovers!
I am an undergraduate student in Statistics, and for a semester project in my Multivariate Analysis course, I decided to work with a dataset on beer reviews. I used R to code and used webscrapped data from [BeerAdvocate.com](http://BeerAdvocate.com) (a beer review website).
Using correspondence analysis, I created a map that depicts the similarity between beers and their predominant sensory characteristics.
The red triangles represent beer styles, and the blue circles represent taste perceptions. So, for example, if I want to drink a beer with a strong hop characteristic, I look for the blue circle labeled ‘hoppy’ on the map and find different styles around that point that contain this characteristic.
Nearby points tend to have the same taste/feel. So, if you like one style and want to try another similar style, this map would help.
This map contains 103 different beer styles and 11 taste perceptions, which are: Alcohol, Body, Malty, Sweet, Salty, Fruity, Sour, Astringent, Malty, Hoppy, and Spices.
Of course, there may be styles that are not correctly ‘classified’. If you find any, please let me know.
Good work. But what about naming the axis brother?