
Tools Used: Canva App
Sources:
https://sidra.ibge.gov.br/pesquisa/censo-demografico/demografico-2022/amostra-religioes
https://www.ibge.gov.br/en/statistics/social/labor/22836-2022-census-3.html
Methodology:
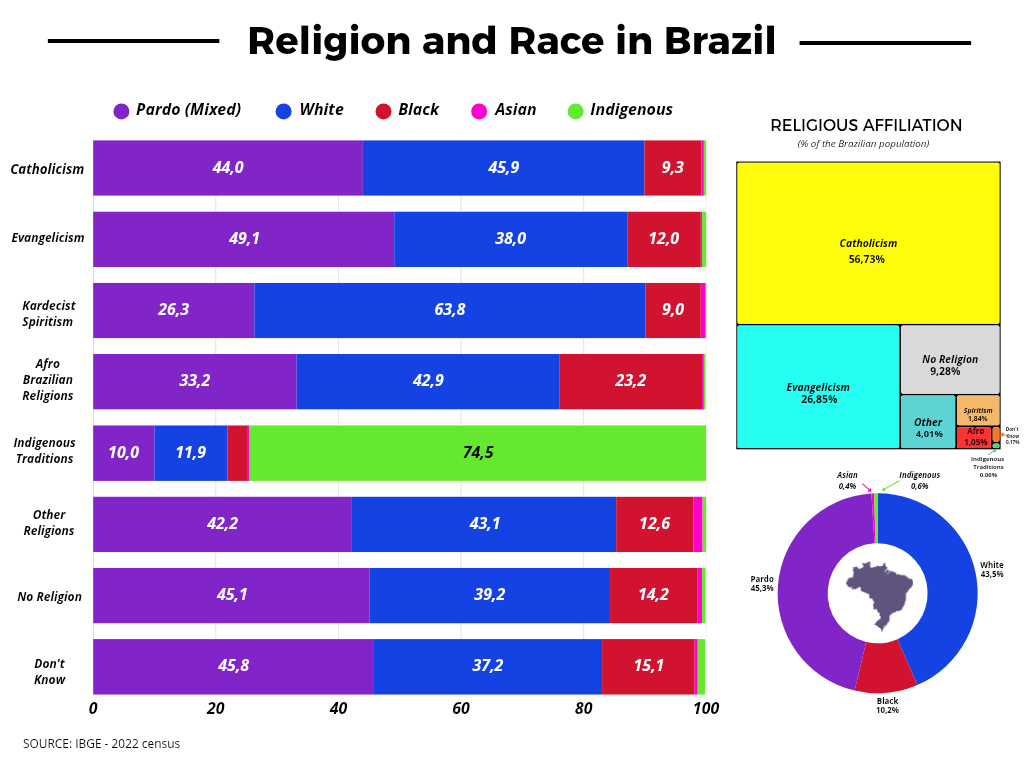
All data comes from the official IBGE 2022 Census (cross-tabulation of religion by color/race).
I downloaded the tables from IBGE SIDRA, cleaned and formatted the percentages in R, and built the visualization using ggplot2.
The main chart shows the racial composition within each religious group using stacked horizontal bars. The square chart on the right displays the overall religious affiliation of the Brazilian population, while the donut chart shows the overall racial/color composition. Minor rounding follows the official published figures.
by Beautiful-Rough2310
1 Comment
Tools Used: Canva App
Sources:
https://agenciadenoticias.ibge.gov.br/en/agencia-news/2184-news-agency/news/43602-2022-census-catholics-remain-in-decline-protestants-and-persons-with-no-religion-increase-in-the-country
https://sidra.ibge.gov.br/pesquisa/censo-demografico/demografico-2022/amostra-religioes
https://www.ibge.gov.br/en/statistics/social/labor/22836-2022-census-3.html
Methodology:
All data comes from the official IBGE 2022 Census (cross-tabulation of religion by color/race).
I downloaded the tables from IBGE SIDRA, cleaned and formatted the percentages in R, and built the visualization using ggplot2.
The main chart shows the racial composition within each religious group using stacked horizontal bars. The square chart on the right displays the overall religious affiliation of the Brazilian population, while the donut chart shows the overall racial/color composition. Minor rounding follows the official published figures.