
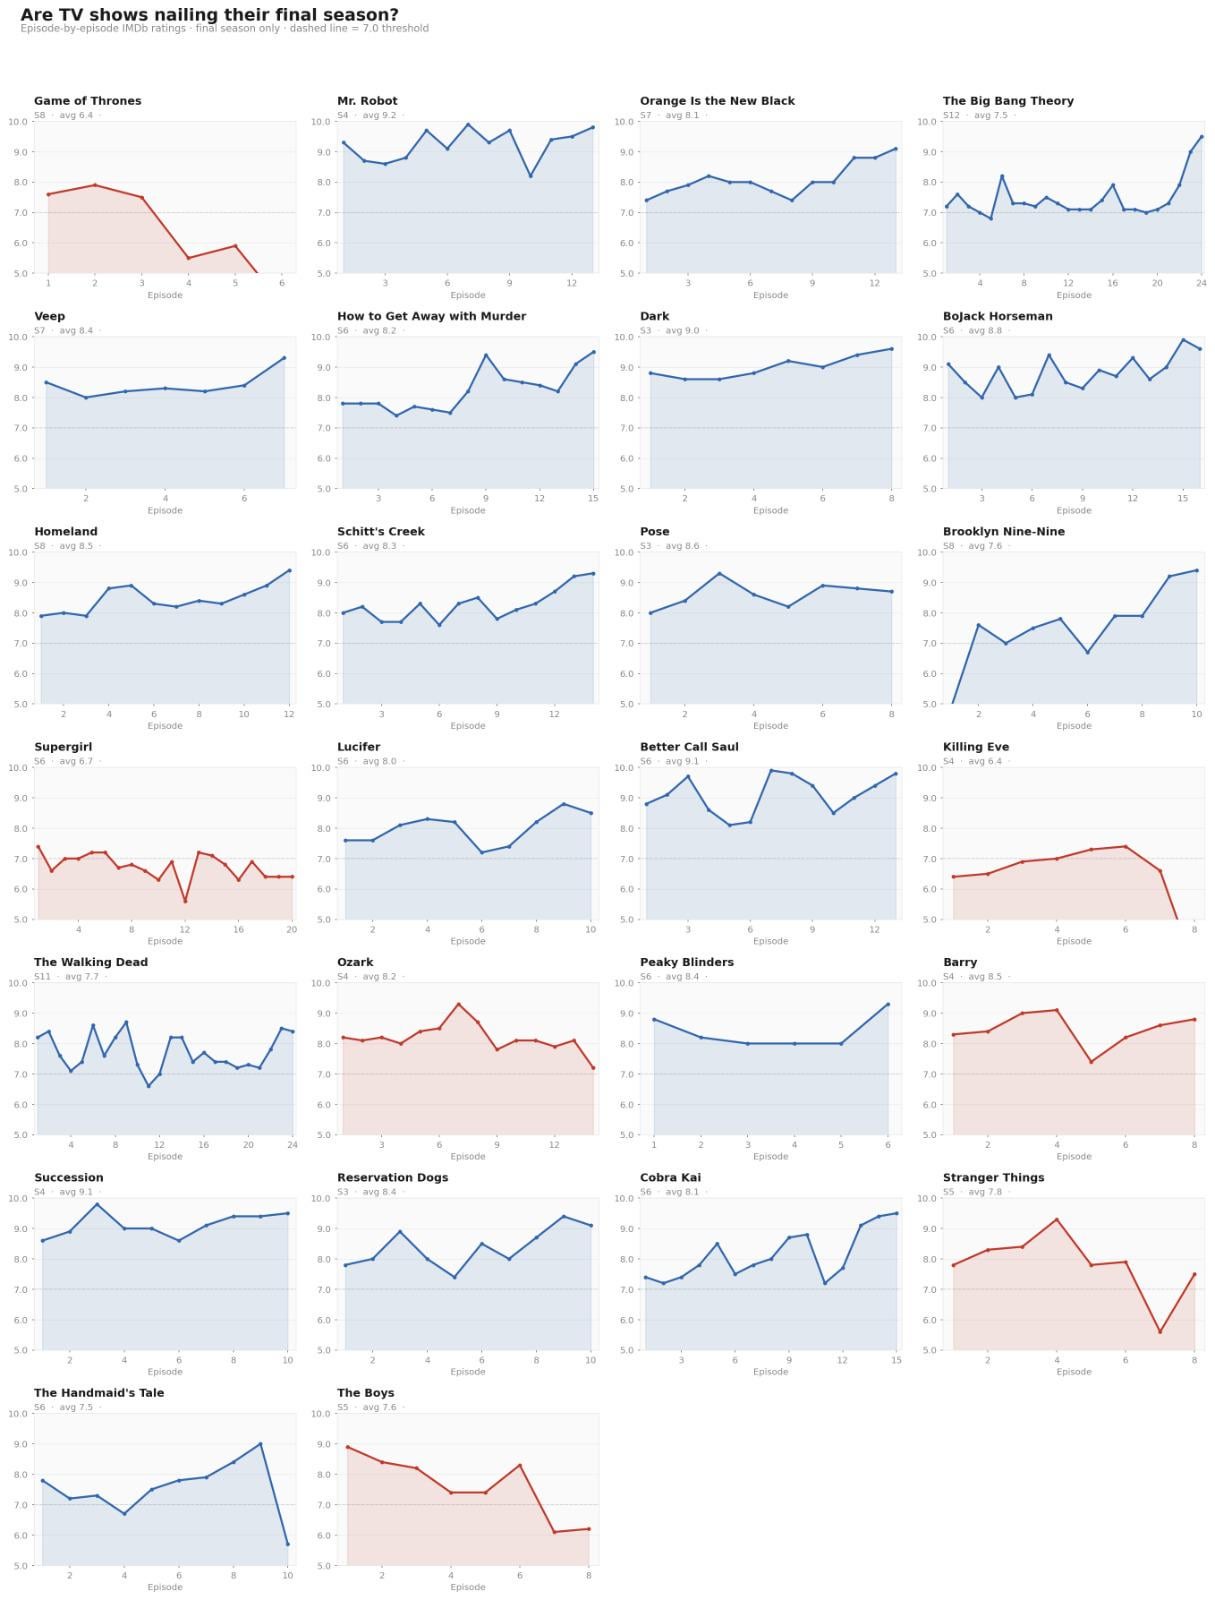
The recent piss poor ending of The Boys and Stranger Things made me think "Is this every TV show's fate? Start strong and then crash spectacularly?"
So I fired up Python and I scrapped IMDB for TV shows from 2019-2026.
Blue and red graphs: It's based on whether the second half of the final season rated lower than the first half
This is my first post here, so let me know how I can explain things with more depth
I did take some help from clanker to code this
Reposted because earlier there was a different Y axis for each graph
by PuffcornSucks
1 Comment
Data Source: IMDB
Viz Tool : Python