[OC] Weekly Report of US Congress Stock Trades (May 07 – May 18): $12.3M Total Volume, 170 Trades, and Current Market Sentiment
by Daka2020

[OC] Weekly Report of US Congress Stock Trades (May 07 – May 18): $12.3M Total Volume, 170 Trades, and Current Market Sentiment
by Daka2020
1 Comment
***Data Source & Methodology:***
The data is aggregated directly from the official US House and Senate financial disclosure reports (STOCK Act filings).
***Tools Used:***
I built a custom data pipeline using Python (BeautifulSoup and requests for fetching files, sqlite3 for data storage, and pandas for calculating market sentiment and top assets). The visual report template is generated automatically and distributed via a tracking bot framework.
***Some interesting takeaways from this period:***
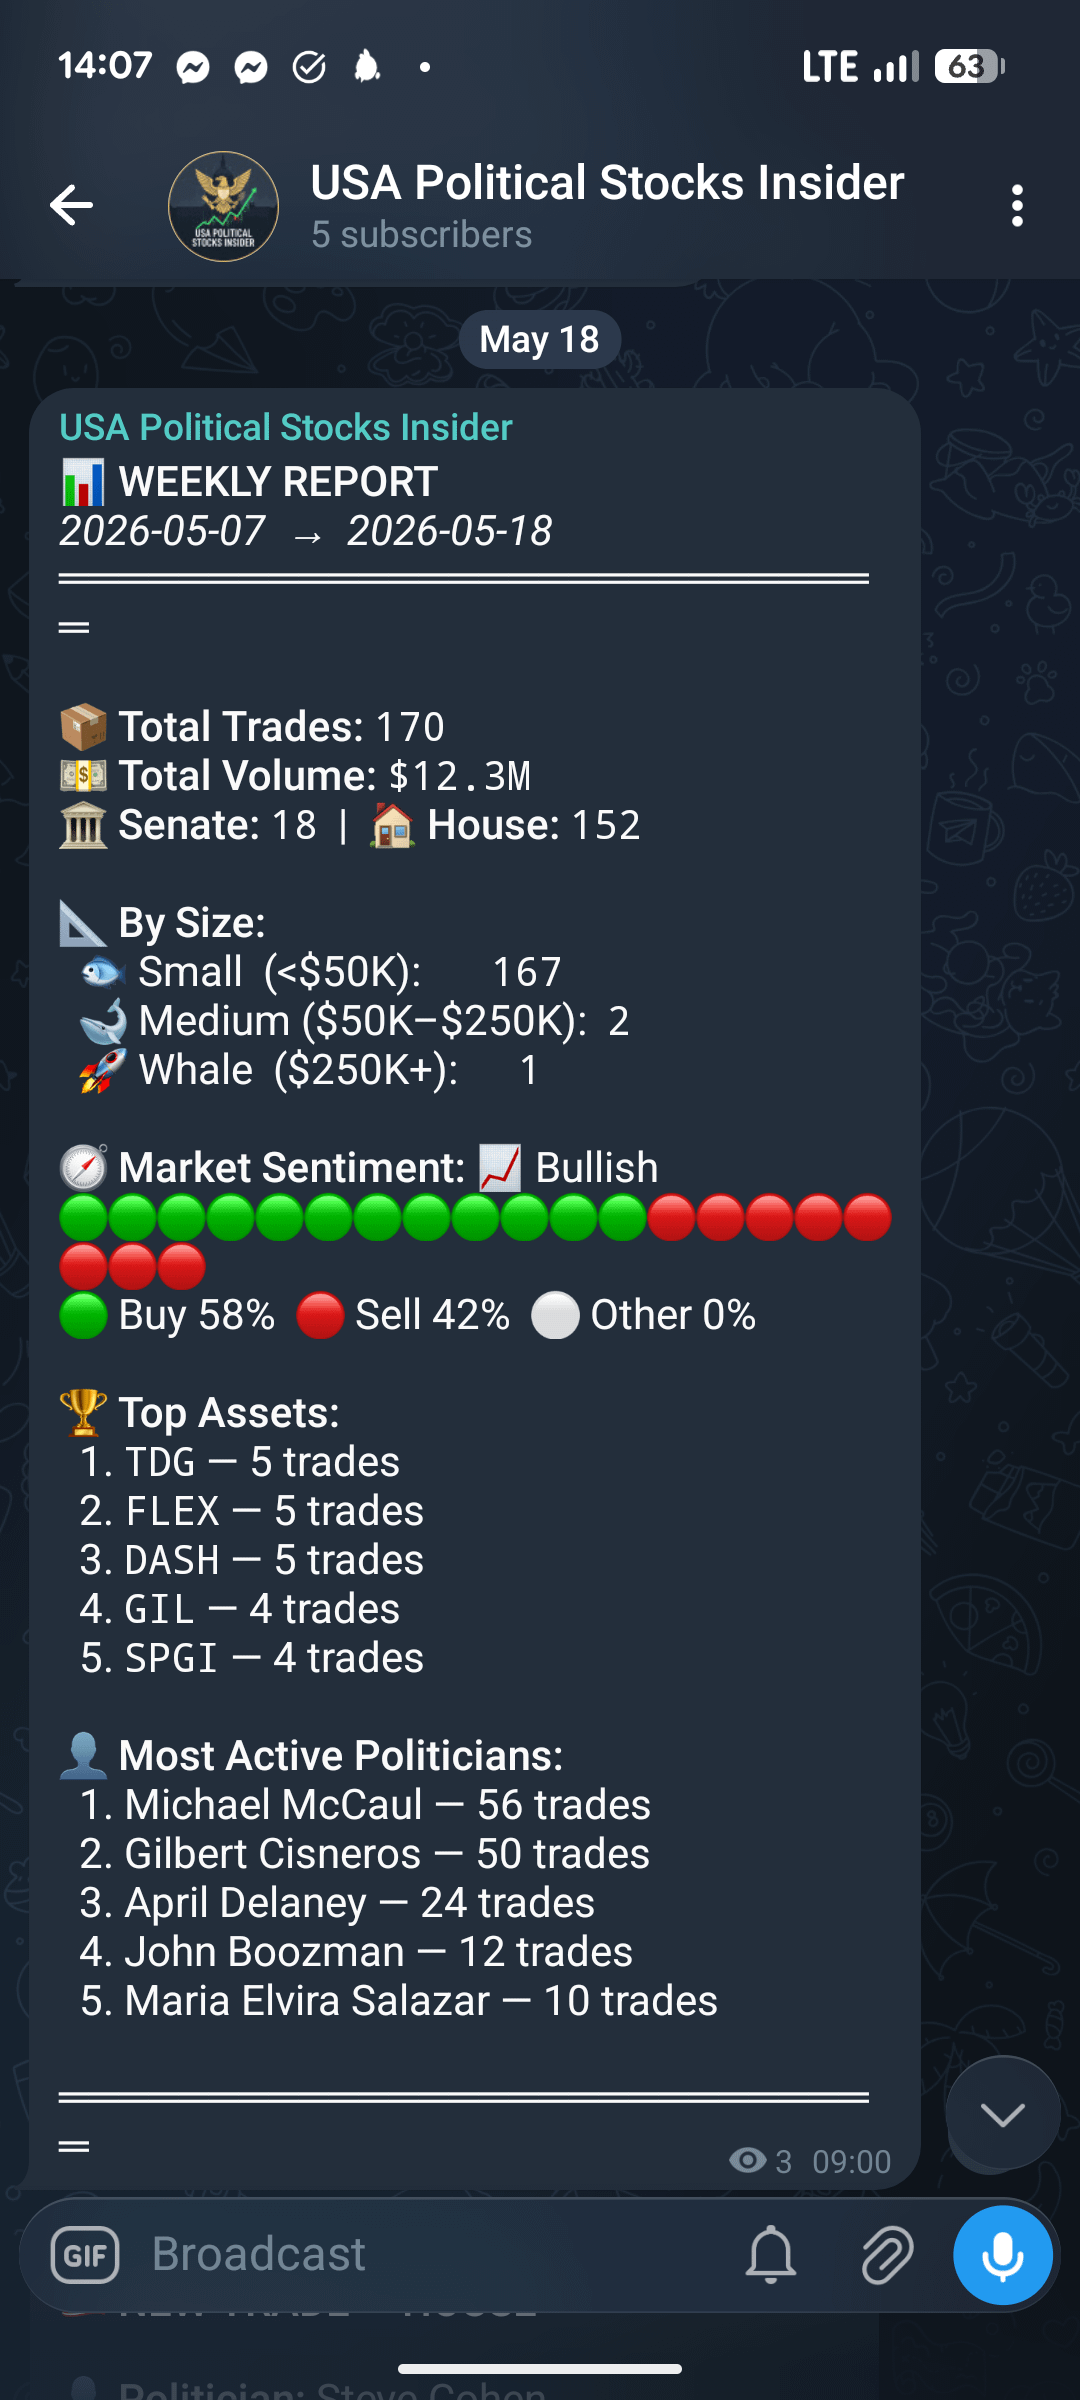
1. **Volume:** A massive $12.3M moved across 170 trades.
2. **Sentiment:** Overall bullish with 58% buys vs 42% sells.
3. **Activity:** Michael McCaul and Gilbert Cisneros completely dominated the trading volume during these 11 days.
The core tracking dashboard is completely free to look at. Happy to answer any questions about the data pipeline or findings!