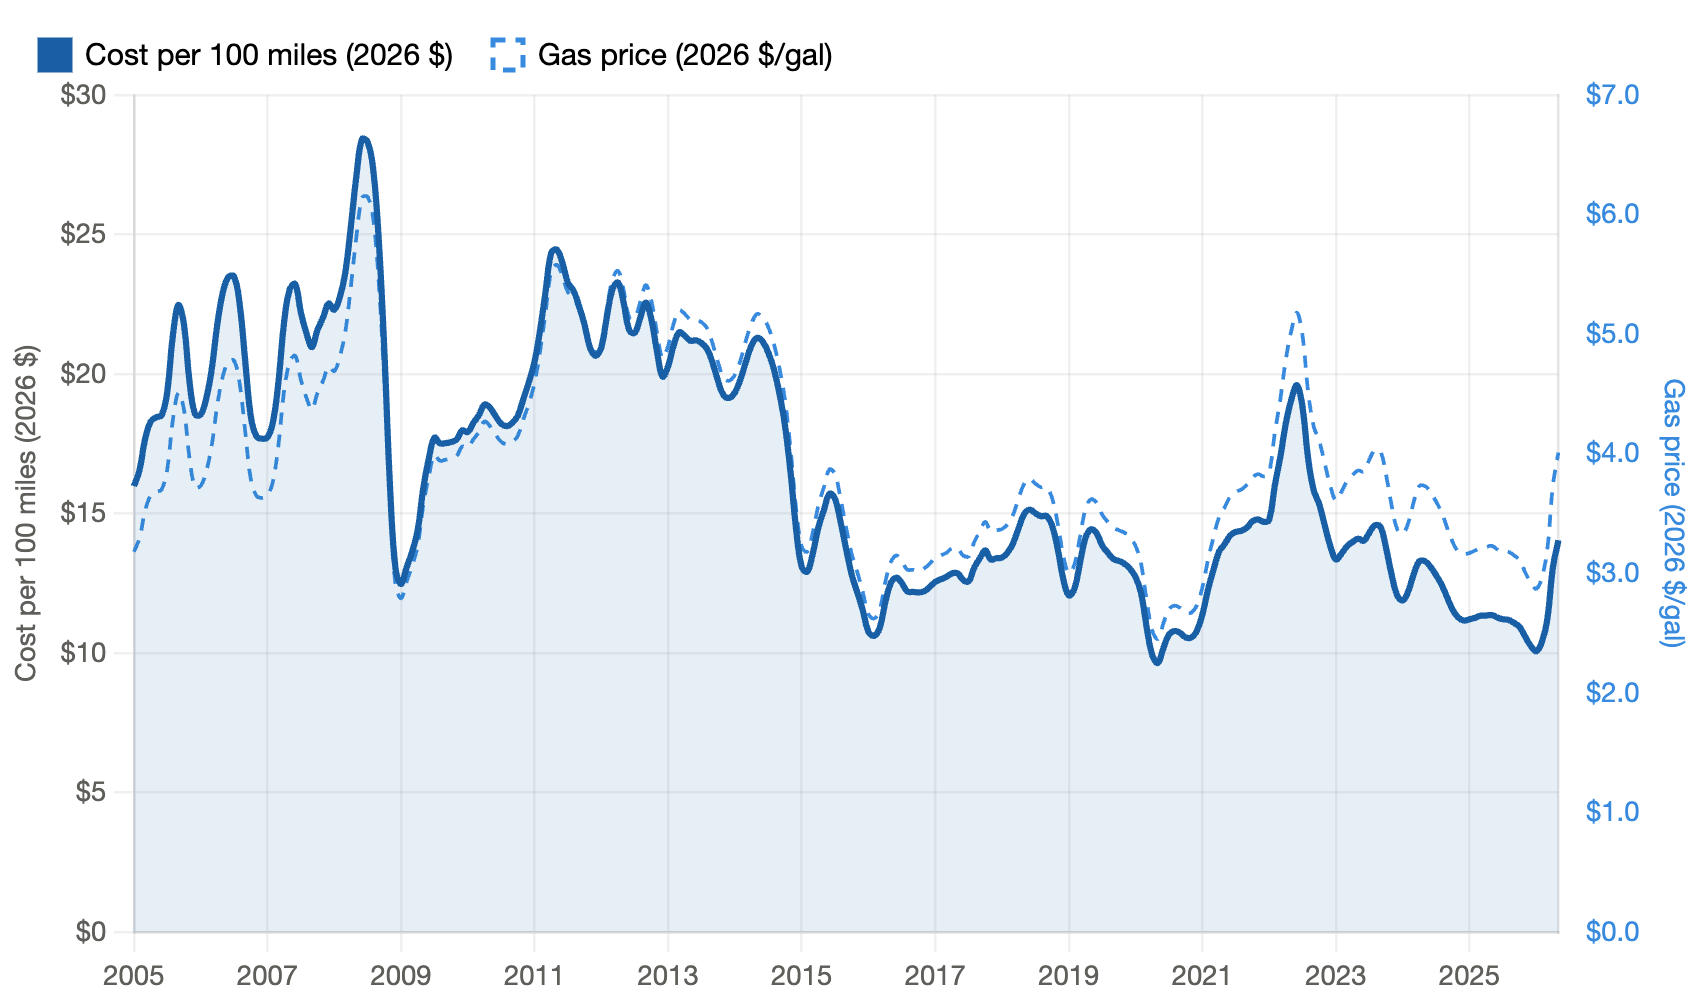
Sources: EIA monthly retail gas prices, BLS CPI for inflation, EPA Automotive Trends Report for mileage
Tool: Claude
by Fricklefrazz

Sources: EIA monthly retail gas prices, BLS CPI for inflation, EPA Automotive Trends Report for mileage
Tool: Claude
by Fricklefrazz
11 Comments
Sources: EIA monthly retail gas prices, BLS CPI for inflation, EPA Automotive Trends Report for mileage
Tool: Claude
Reposted to fix a couple of things people pointed out on the last one.
This won’t be a popular post, because it doesn’t show what Reddit wants to believe.
Seems more like propaganda than something I can actually use for analysis.
Why would it be inflation based if it’s a major component of inflation?
Uhhh… or just look at the official inflation report from 2023 from the Dept of Energy? lol
https://afdc.energy.gov/data/10641
Well this is an interesting graph, I would love to see if a correlation between fuel efficiency and EV development affected the cost/100 miles by influencing consumer habits.
Wait. Does this show that the cost to drive 100 miles is directly related to the price of gas?
…do we need a chart to show us that? Seems self evident.
A little clarification on what mirage adjusted means and how it is calculated might be nice. I assume it means you are taking some measure of US fleet average mileage. Also details on how this is calculated. Ie if this fleet mileage is for “cars” and excludes SUVs and trucks that get defined over certain weight class will really change things
Plotting that number as well or giving the number (ie 30 mpg at beginning of graph and 40mpg at end of graph) might help with the context
Any particular reason to stop after 20 years? I’d like to see it compared to the 70s.
To me it looks like there is an inflection point in 2011ish when the two series cross and cost per 100 miles falls below cost per gallon. Vehicles became more efficient over time and that was after cash for clunkers took lots of vics off the road.
Basically average cost to drive a mile then. I like it