Methodology:
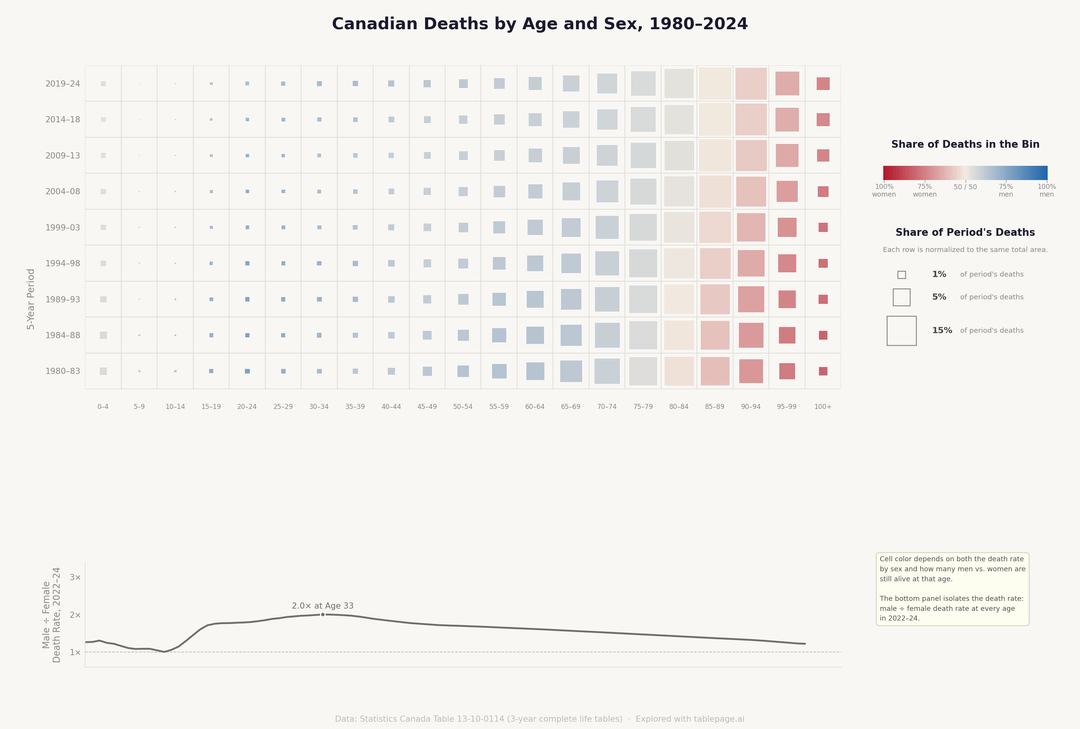
The Canadian tables are in 3-year overlapping windows, while the U.S. ones have a row per year. To make their five-year bins comparable, each Canadian window is weighed by the fraction that falls inside the bin (so every year contributes equally).

2 Comments
Methodology:
The Canadian tables are in 3-year overlapping windows, while the U.S. ones have a row per year. To make their five-year bins comparable, each Canadian window is weighed by the fraction that falls inside the bin (so every year contributes equally).
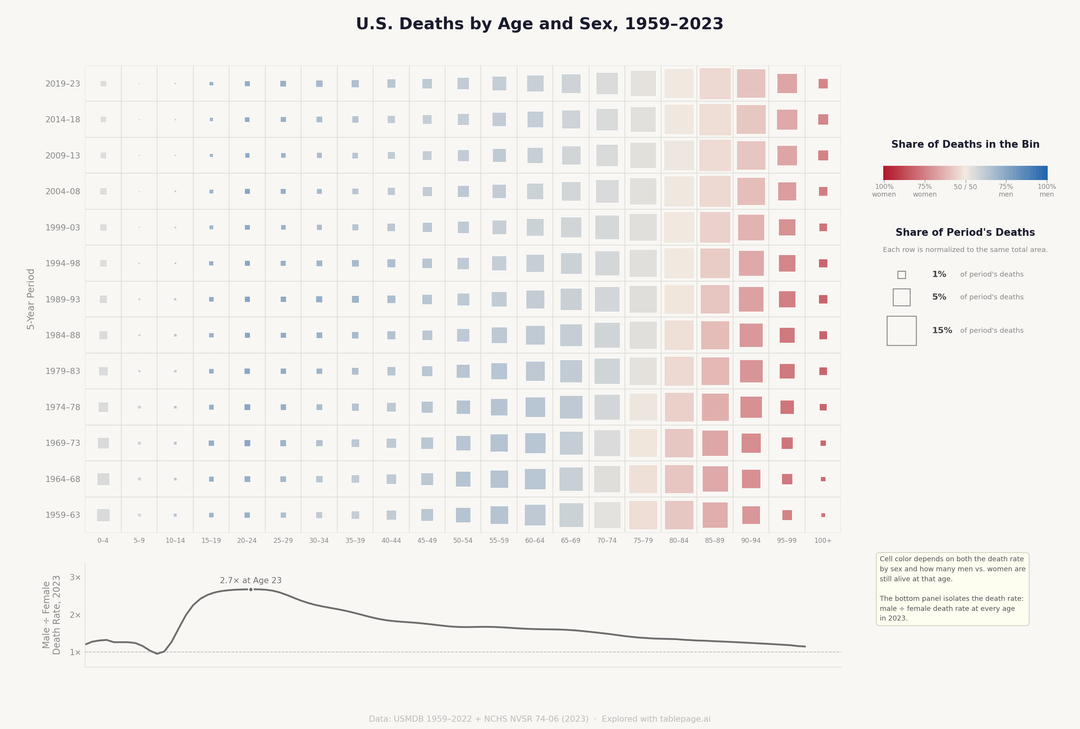
Sources:
– USMDB Life Tables 1959–2022: [https://dataverse.harvard.edu/dataset.xhtml?persistentId=doi:10.7910/DVN/19WYUX](https://dataverse.harvard.edu/dataset.xhtml?persistentId=doi:10.7910/DVN/19WYUX)
– NCHS Life Table 2023: [https://ftp.cdc.gov/pub/health_statistics/nchs/publications/NVSR/74-06/](https://ftp.cdc.gov/pub/health_statistics/nchs/publications/NVSR/74-06/)
– Statistics Canada Life Tables (3 Year Estimates, Excludes PEI): [https://www150.statcan.gc.ca/t1/tbl1/en/tv.action?pid=1310011401](https://)
Tools: python, pandas, matplotlib
Maybe my eyes are tired, but this is a total bitch to read even blown up on a 27-inch 1440p monitor.