
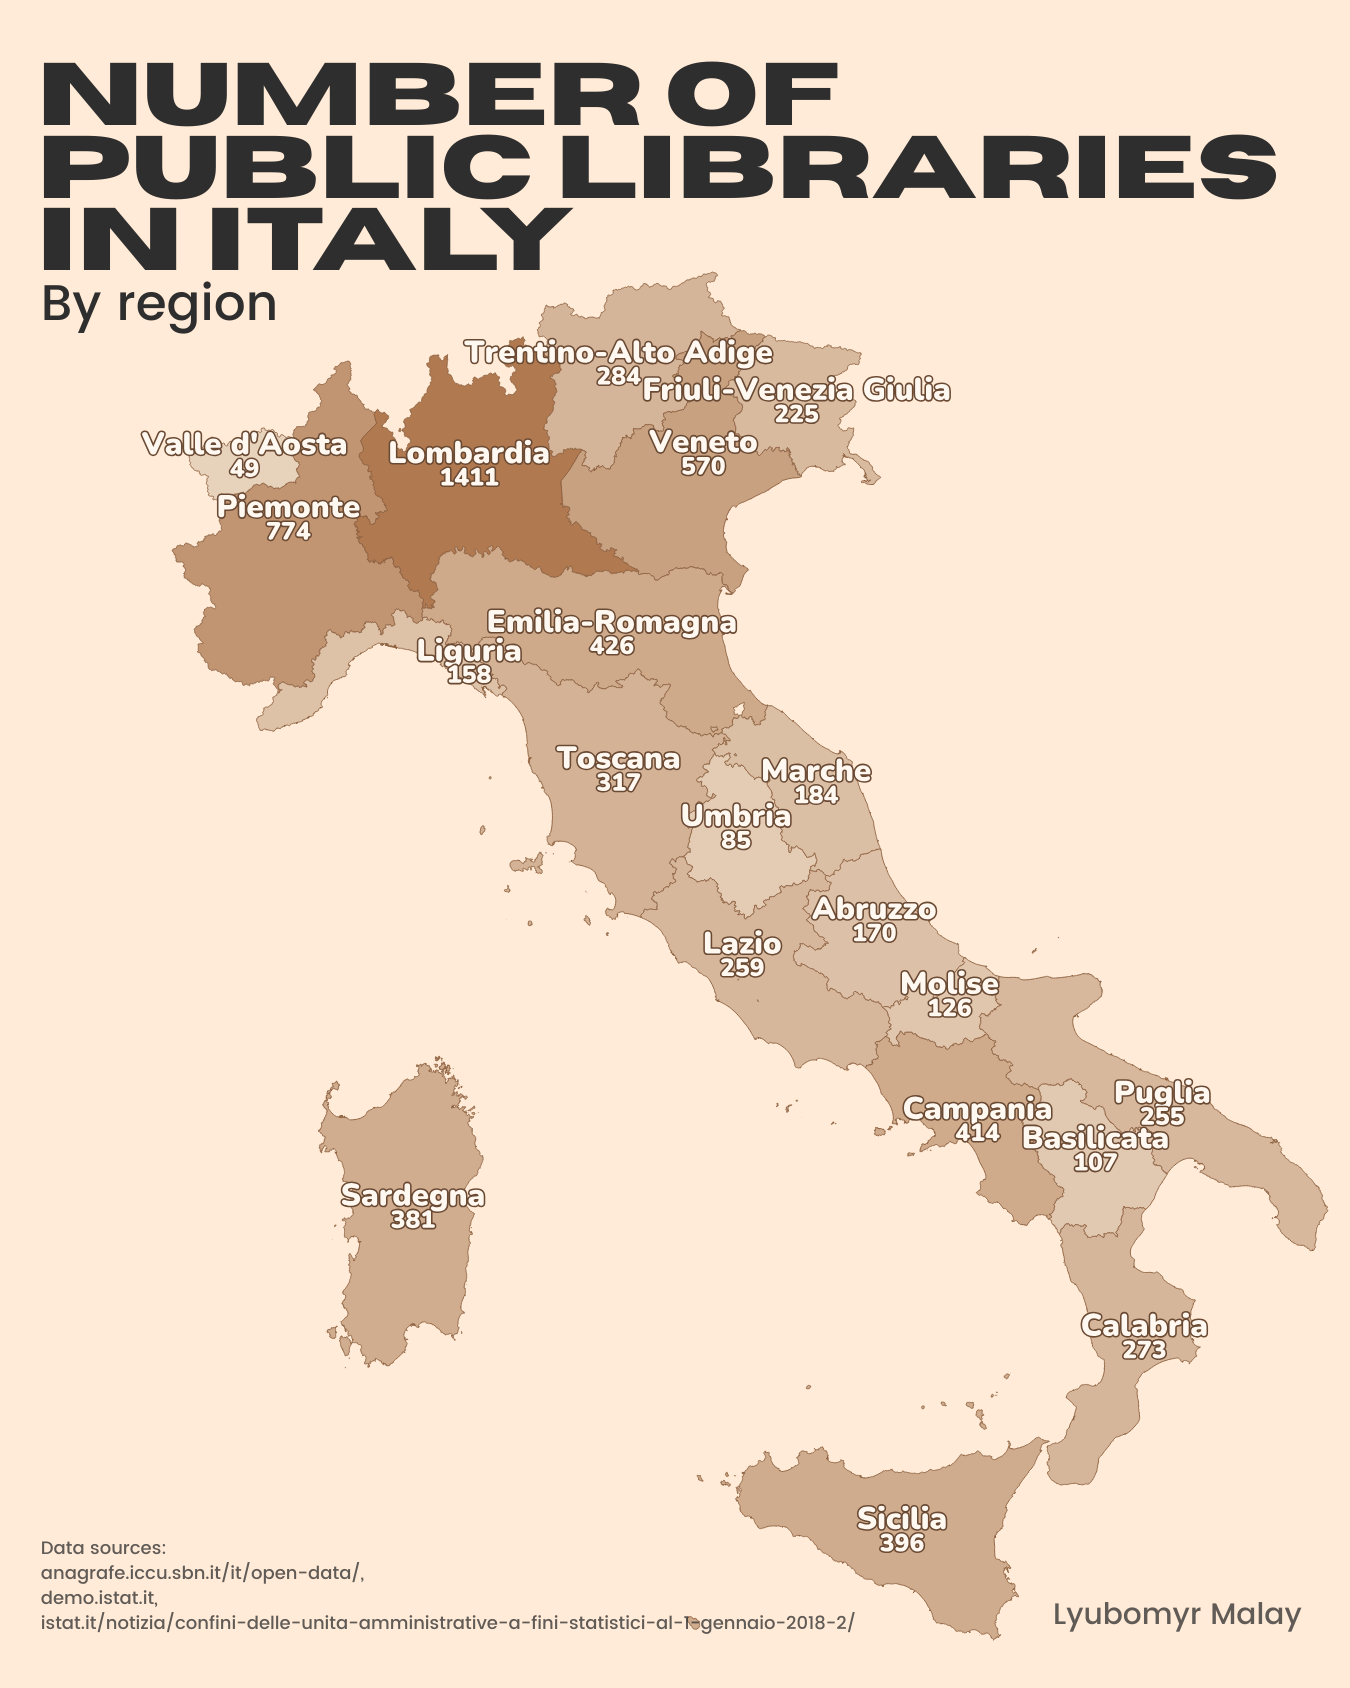
Public municipal libraries by region in Italy
Counts include only municipal public libraries with public access. Municipalities covered shows how many municipalities in the region have at least one library.
Data sources:
- anagrafe.iccu.sbn.it/it/open-data/,
- demo.istat.it,
- istat.it/notizia/confini-delle-unita-amministrative-a-fini-statistici-al-1-gennaio-2018-2/
| REGION | LIBRARIES | POPULATION | LIBRARIES PER 100K | PER CAPITA | MUNICIPALITIES COVERED |
|---|---|---|---|---|---|
| Lombardia | 1411 | 10065694 | 14.02 | 7134 | 1236/1502 (82.3%) |
| Piemonte | 774 | 4255006 | 18.19 | 5497 | 728/1180 (61.7%) |
| Veneto | 570 | 4857460 | 11.73 | 8522 | 489/560 (87.3%) |
| Emilia-Romagna | 426 | 4477009 | 9.52 | 10509 | 305/330 (92.4%) |
| Campania | 414 | 5568703 | 7.43 | 13451 | 381/550 (69.3%) |
| Sicilia | 396 | 4775194 | 8.29 | 12059 | 357/391 (91.3%) |
| Sardegna | 381 | 1554490 | 24.51 | 4080 | 354/377 (93.9%) |
| Toscana | 317 | 3659222 | 8.66 | 11543 | 248/273 (90.8%) |
| Trentino-Alto Adige | 284 | 1090818 | 26.04 | 3841 | 179/282 (63.5%) |
| Calabria | 273 | 1827571 | 14.94 | 6694 | 261/404 (64.6%) |
| Lazio | 259 | 5709444 | 4.54 | 22044 | 237/378 (62.7%) |
| Puglia | 255 | 3865277 | 6.60 | 15158 | 236/257 (91.8%) |
| Friuli-Venezia Giulia | 225 | 1193496 | 18.85 | 5304 | 200/215 (93.0%) |
| Marche | 184 | 1479832 | 12.43 | 8043 | 149/225 (66.2%) |
| Abruzzo | 170 | 1267222 | 13.42 | 7454 | 155/305 (50.8%) |
| Liguria | 158 | 1511988 | 10.45 | 9570 | 131/234 (56.0%) |
| Molise | 126 | 285940 | 44.07 | 2269 | 118/136 (86.8%) |
| Basilicata | 107 | 525281 | 20.37 | 4909 | 104/131 (79.4%) |
| Umbria | 85 | 850627 | 9.99 | 10007 | 72/92 (78.3%) |
| Valle d'Aosta | 49 | 122554 | 39.98 | 2501 | 47/74 (63.5%) |
| TOTAL | 6864 | 58942828 | 11.65 | 8587 | 5987/7896 (75.8%) |
Note: totals per region are calculated by spatially joining library POI coordinates to municipality polygons, counting POIs inside each municipality, and aggregating those counts by region. Only municipal, public, non-reserved libraries are included.
Lyubomyr Malay
by lvubomvr
4 Comments
Data sources:
* [anagrafe.iccu.sbn.it/it/open-data/](http://anagrafe.iccu.sbn.it/it/open-data/),
* [demo.istat.it](http://demo.istat.it),
* [istat.it/notizia/confini-delle-unita-amministrative-a-fini-statistici-al-1-gennaio-2018-2/](http://istat.it/notizia/confini-delle-unita-amministrative-a-fini-statistici-al-1-gennaio-2018-2/)
Tools used:
* Python (geopandas, shapely, matplotlib)
* Affinity
This should be per cap in the figure. cool data bad visual.
I think libraries per population is more significant than number of libraries as absolute value, since more densely populated areas tend to have more libraries
A big reason for why there is so many libraries in Lombardia is that it has an insane number of municipalities, and most of them are bound to have a local library. I’m willing to bet you a map of number of municipalities per region would line up pretty well with this.