Does that mean that the chart from 1859 to 1970 is essentially just showing the change in the price of oil? If so, then doesn’t that make the meaning of this chart different before and after that point?
Temporary_Stranger39 on
I want to see a gold to Big Mac ratio.
TeilzeitOptimist on
That’s why Trump wants to “check” on the gold reserves again?

5 Comments
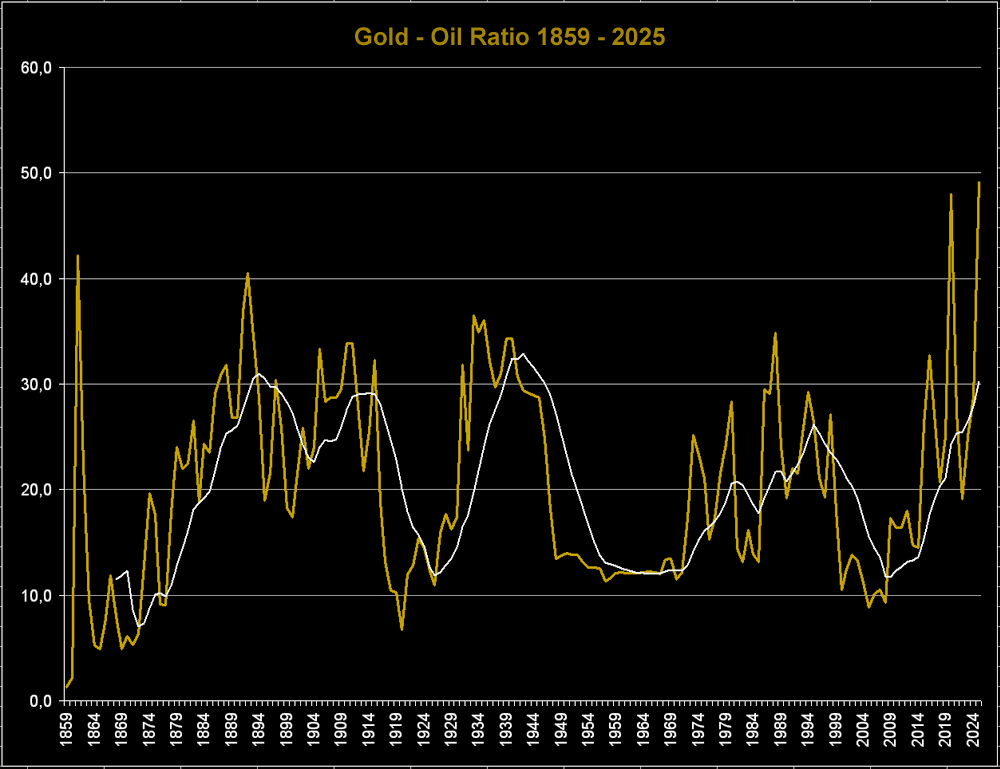
Data source:
Crude oil prices (annual averages, 1859–present): [https://www.statista.com/statistics/1360959/american-crude-oil-prices-historical/](https://www.statista.com/statistics/1360959/american-crude-oil-prices-historical/)
Gold prices (fixed pre‑1971, market averages after): [https://www.measuringworth.com/datasets/gold/result.php](https://www.measuringworth.com/datasets/gold/result.php)
Tools: Exel
Legend and axis label please
“Gold prices (fixed pre‑1971, market averages after)”
Does that mean that the chart from 1859 to 1970 is essentially just showing the change in the price of oil? If so, then doesn’t that make the meaning of this chart different before and after that point?
I want to see a gold to Big Mac ratio.
That’s why Trump wants to “check” on the gold reserves again?