
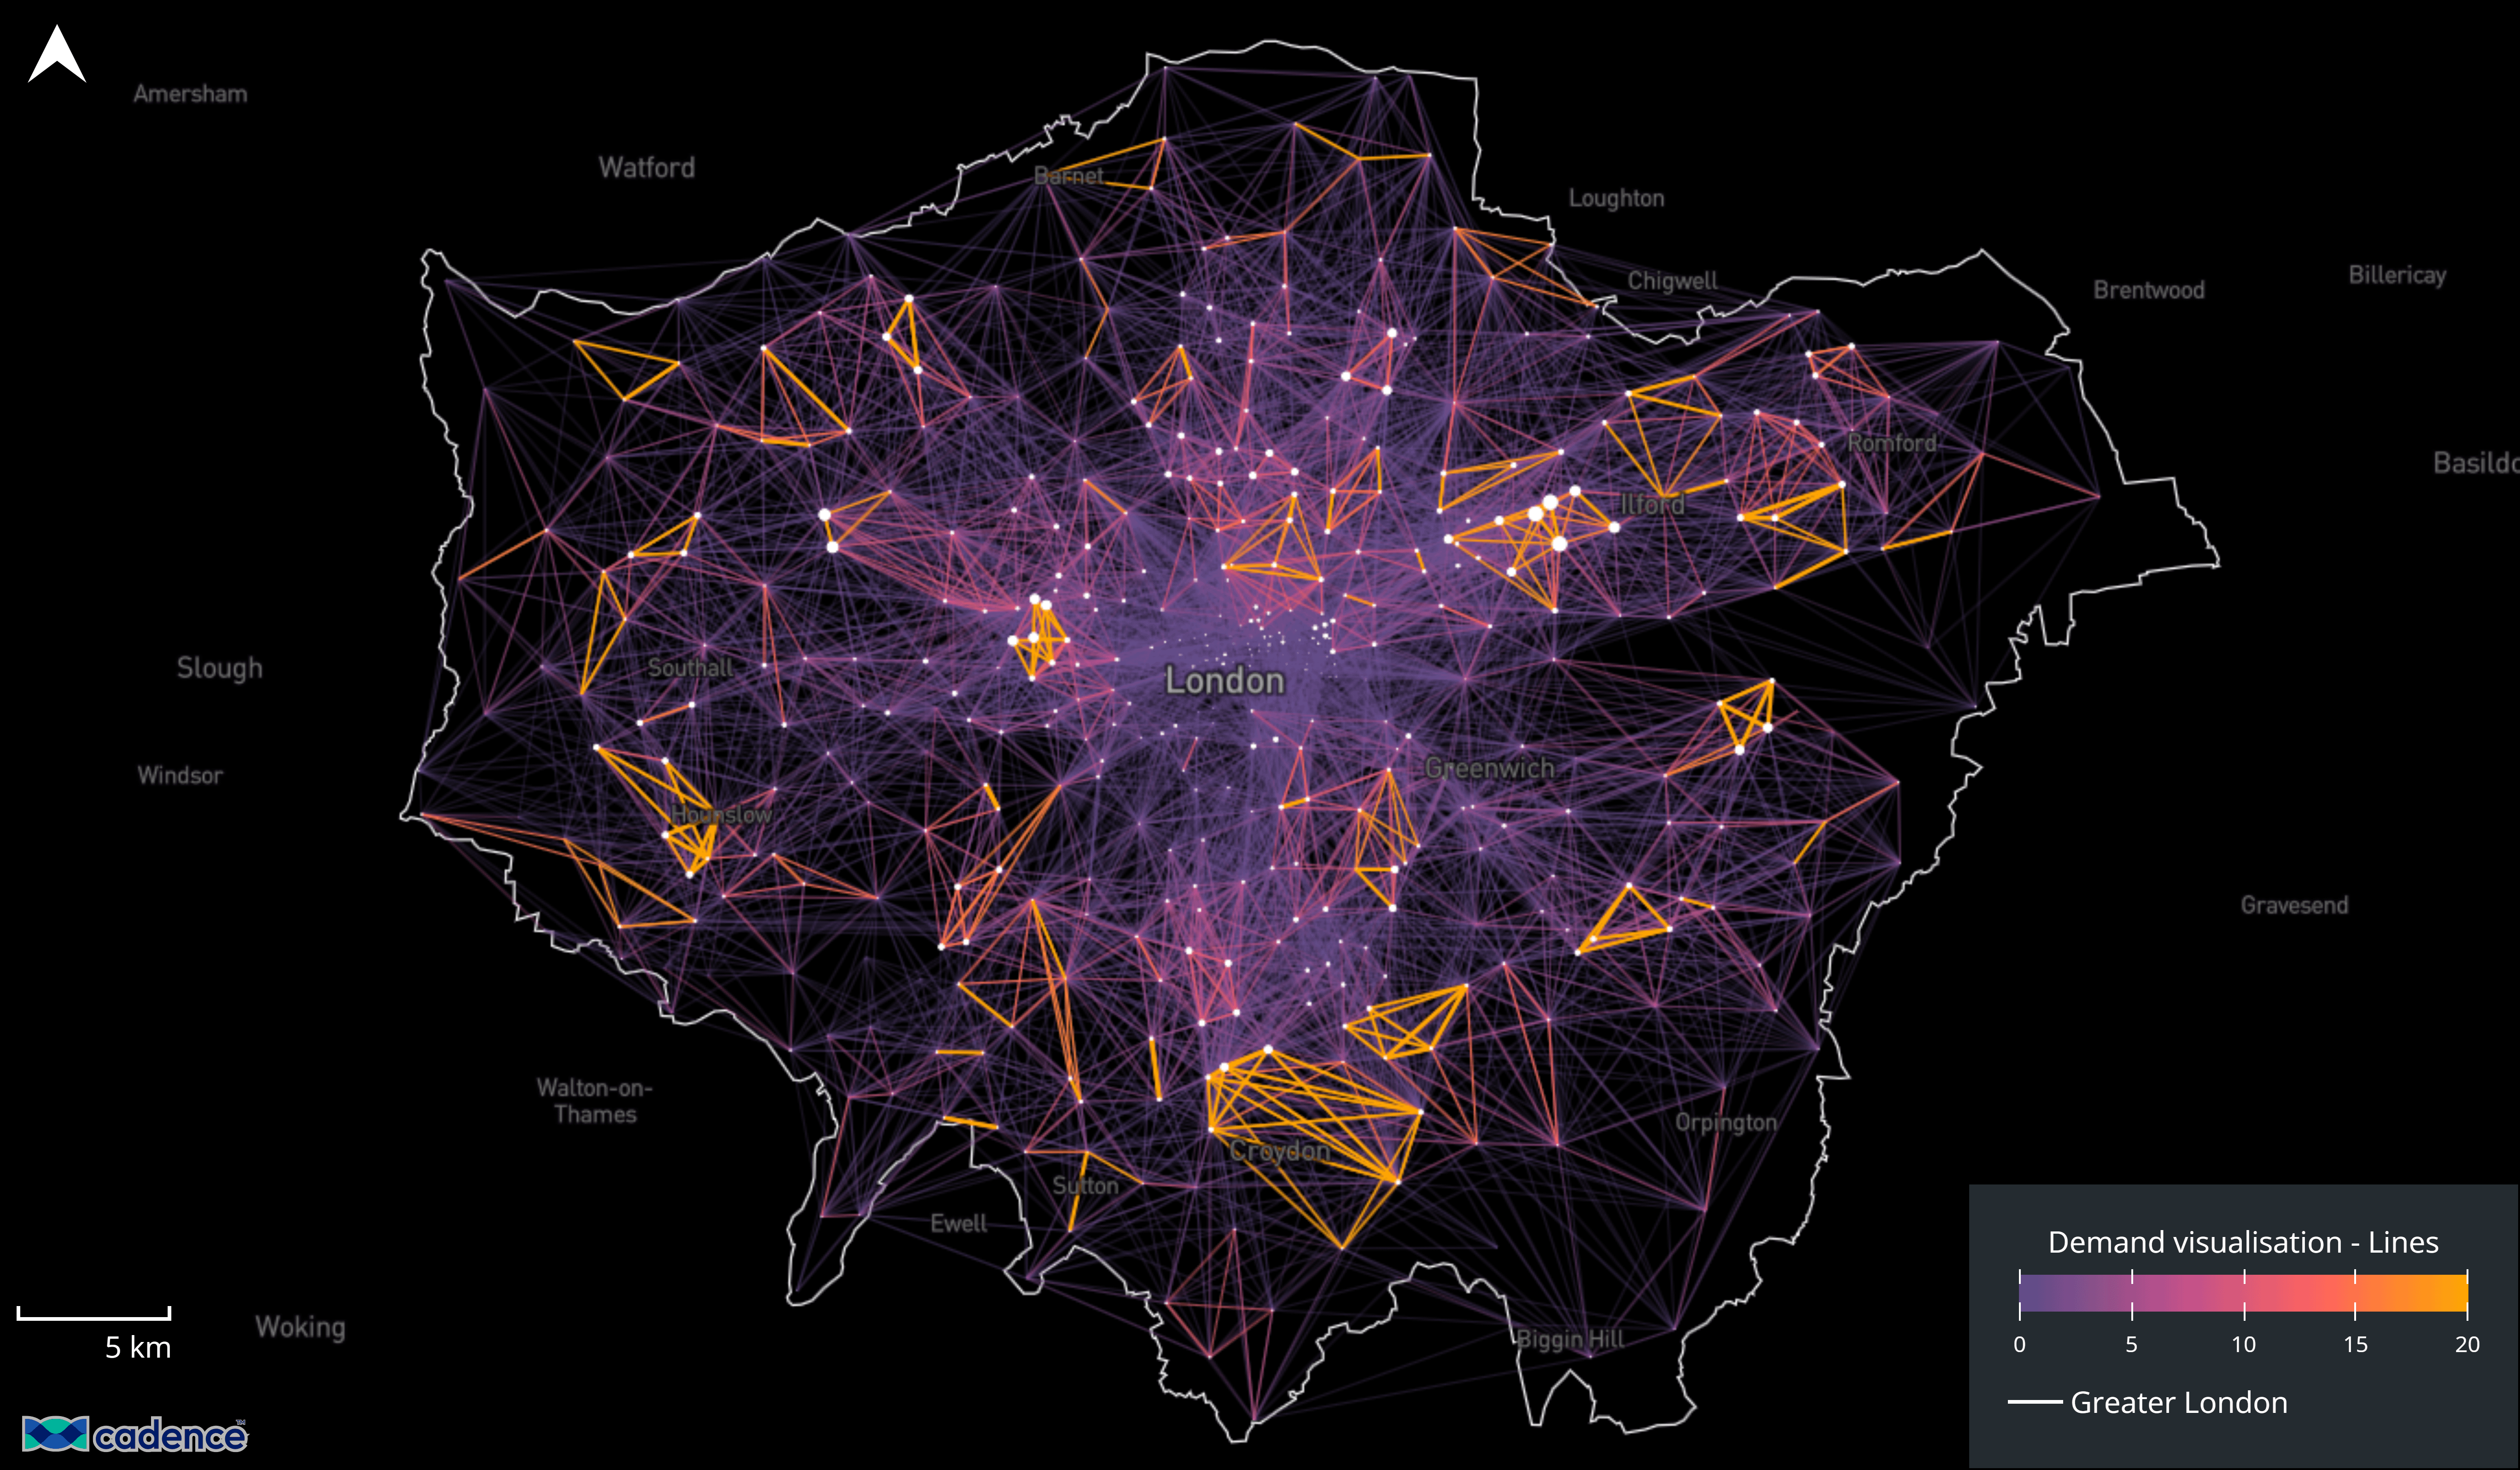
Using ONS Consumer Card Spending Origin Destination data. This dataset looked at the proportion of money spent between postcodes based on where the spender lived and where the merchant was located. The white centroids on the map are scaled to show the Total incoming demand for that postcode district. When looking at this data across London, it's really clear to see that the suburbs of London spend their money locally. The centre of London isn't as much of a draw, proportionally speaking. Croydon, Stratford, Notting hill, and Hounslow all show quite strong local spending trends.
Dataset can be found here: Consumer card spending, UK tourism-related sectors – Office for National Statistics
I used Cadence to make and visualise the map: https://cadence360.cityscience.com/
by ILikeMapsAndGIS
1 Comment
**Source**: [Consumer card spending, UK tourism-related sectors – Office for National Statistics](https://www.ons.gov.uk/economy/economicoutputandproductivity/output/datasets/consumercardspendinguktourismrelatedsectors)
**Tool**: I used Cadence’s demand visualisation tool to make and visualise the map [https://cadence360.cityscience.com/](https://cadence360.cityscience.com/)