
Source: Office of Management and Budget Historical Table 1.1 (FY2027 Budget)
Visualization created in R using GGplot2.
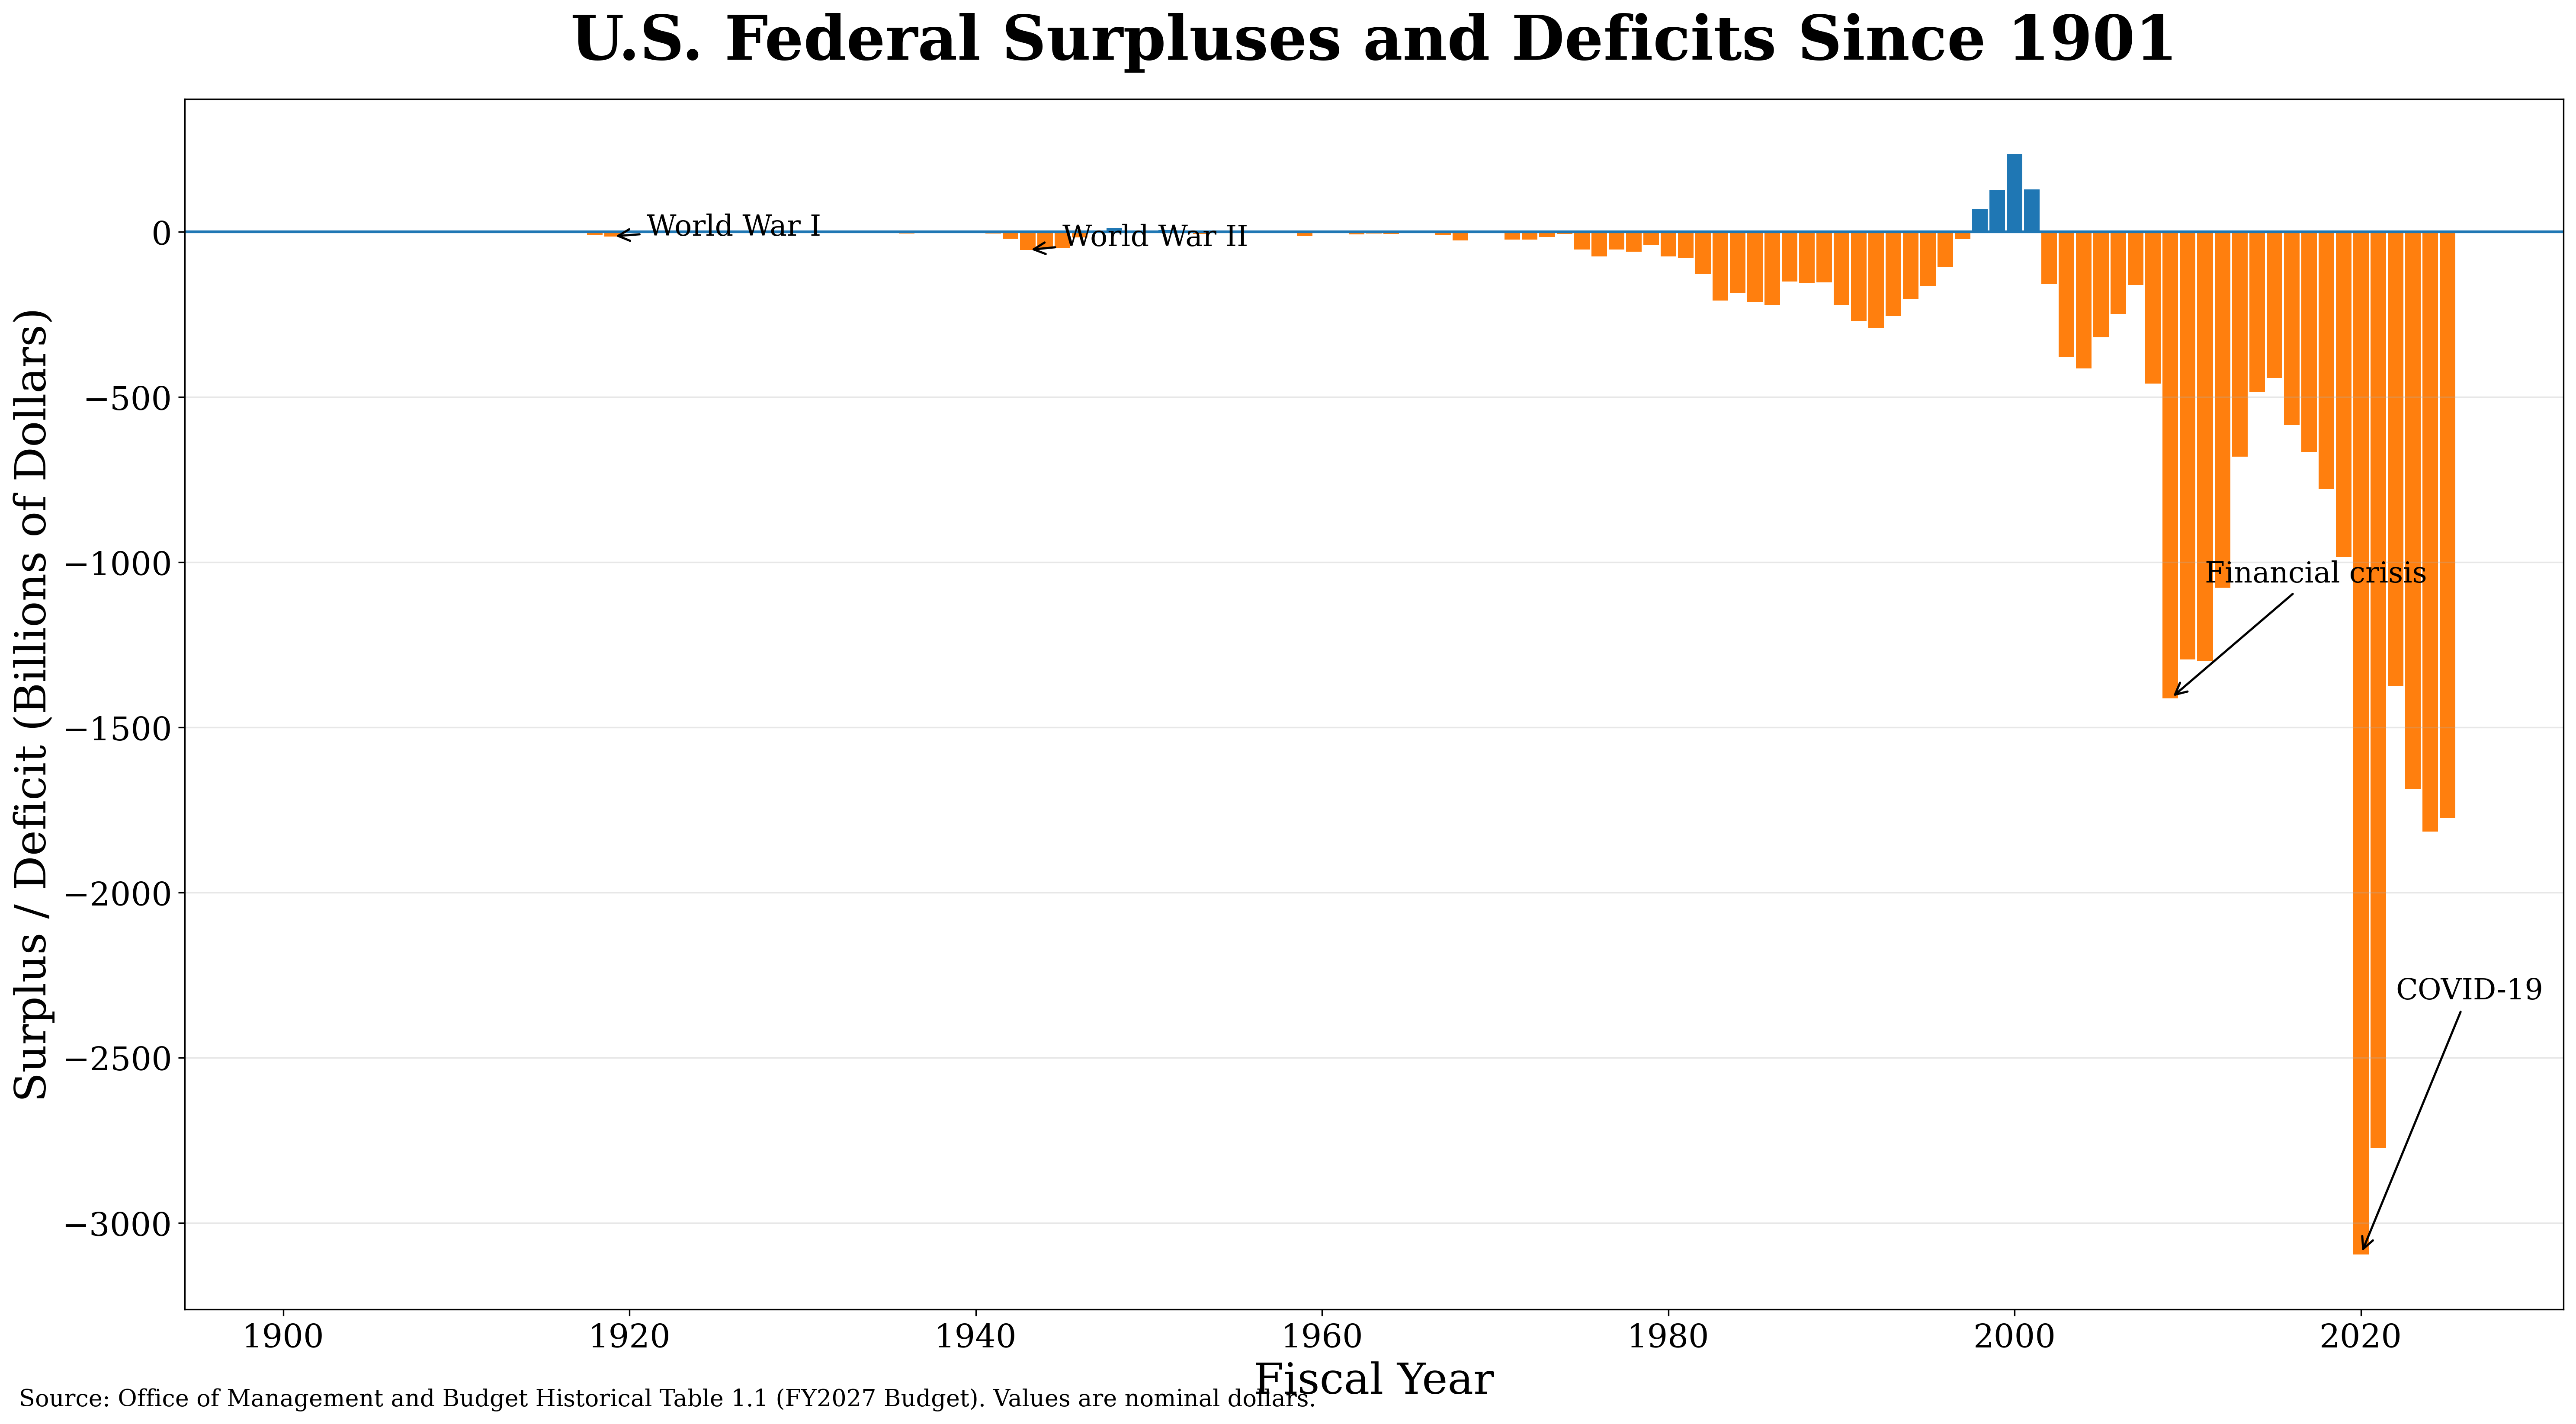
This chart shows annual U.S. federal budget surpluses and deficits from 1901–2025 using historical OMB budget data.
One interesting pattern is how persistent deficits became after the 1970s, with only a brief surplus period during the late 1990s and early 2000s.
Major spikes correspond to periods of war, economic crisis, and large-scale fiscal intervention, including World War I, World War II, the 2008 financial crisis, and COVID-19.
We look forward to hearing your feedback.
by forensiceconomics
8 Comments
what caused that major surplus from like 1997 to 2001?
Just for fun, add some color scheme to show who was president each year. Might be interesting
Would be nice to show this in inflation adjusted dollars and percent of gdp
Jeebus, that was one hell of a recovery under Biden.
“Richest country in the world”
“Major spikes correspond to periods of war, economic crisis, and large-scale fiscal intervention, including World War I, World War II, the 2008 financial crisis, and COVID-19”
And the Reagan years, 1981-88. Trying to spend his way to prosperity without raising taxes, expecting “trickle-down” to benefit all. Helped the rich get much richer, helped kill the middle class, increased the number of poor.
Hmm what happened around 1980 what could it be
that surplus was bill clinton. republicans hate him because he did everything they swear they are going to do.. but forget 5 seconds after taking office and instead just line their pockets