
Data sources: OMB Historical Tables, CBO May 2026 Baseline, BEA
Visualization created in R using ggplot2
OC by Forensic Economic Services LLC / Rule703.com
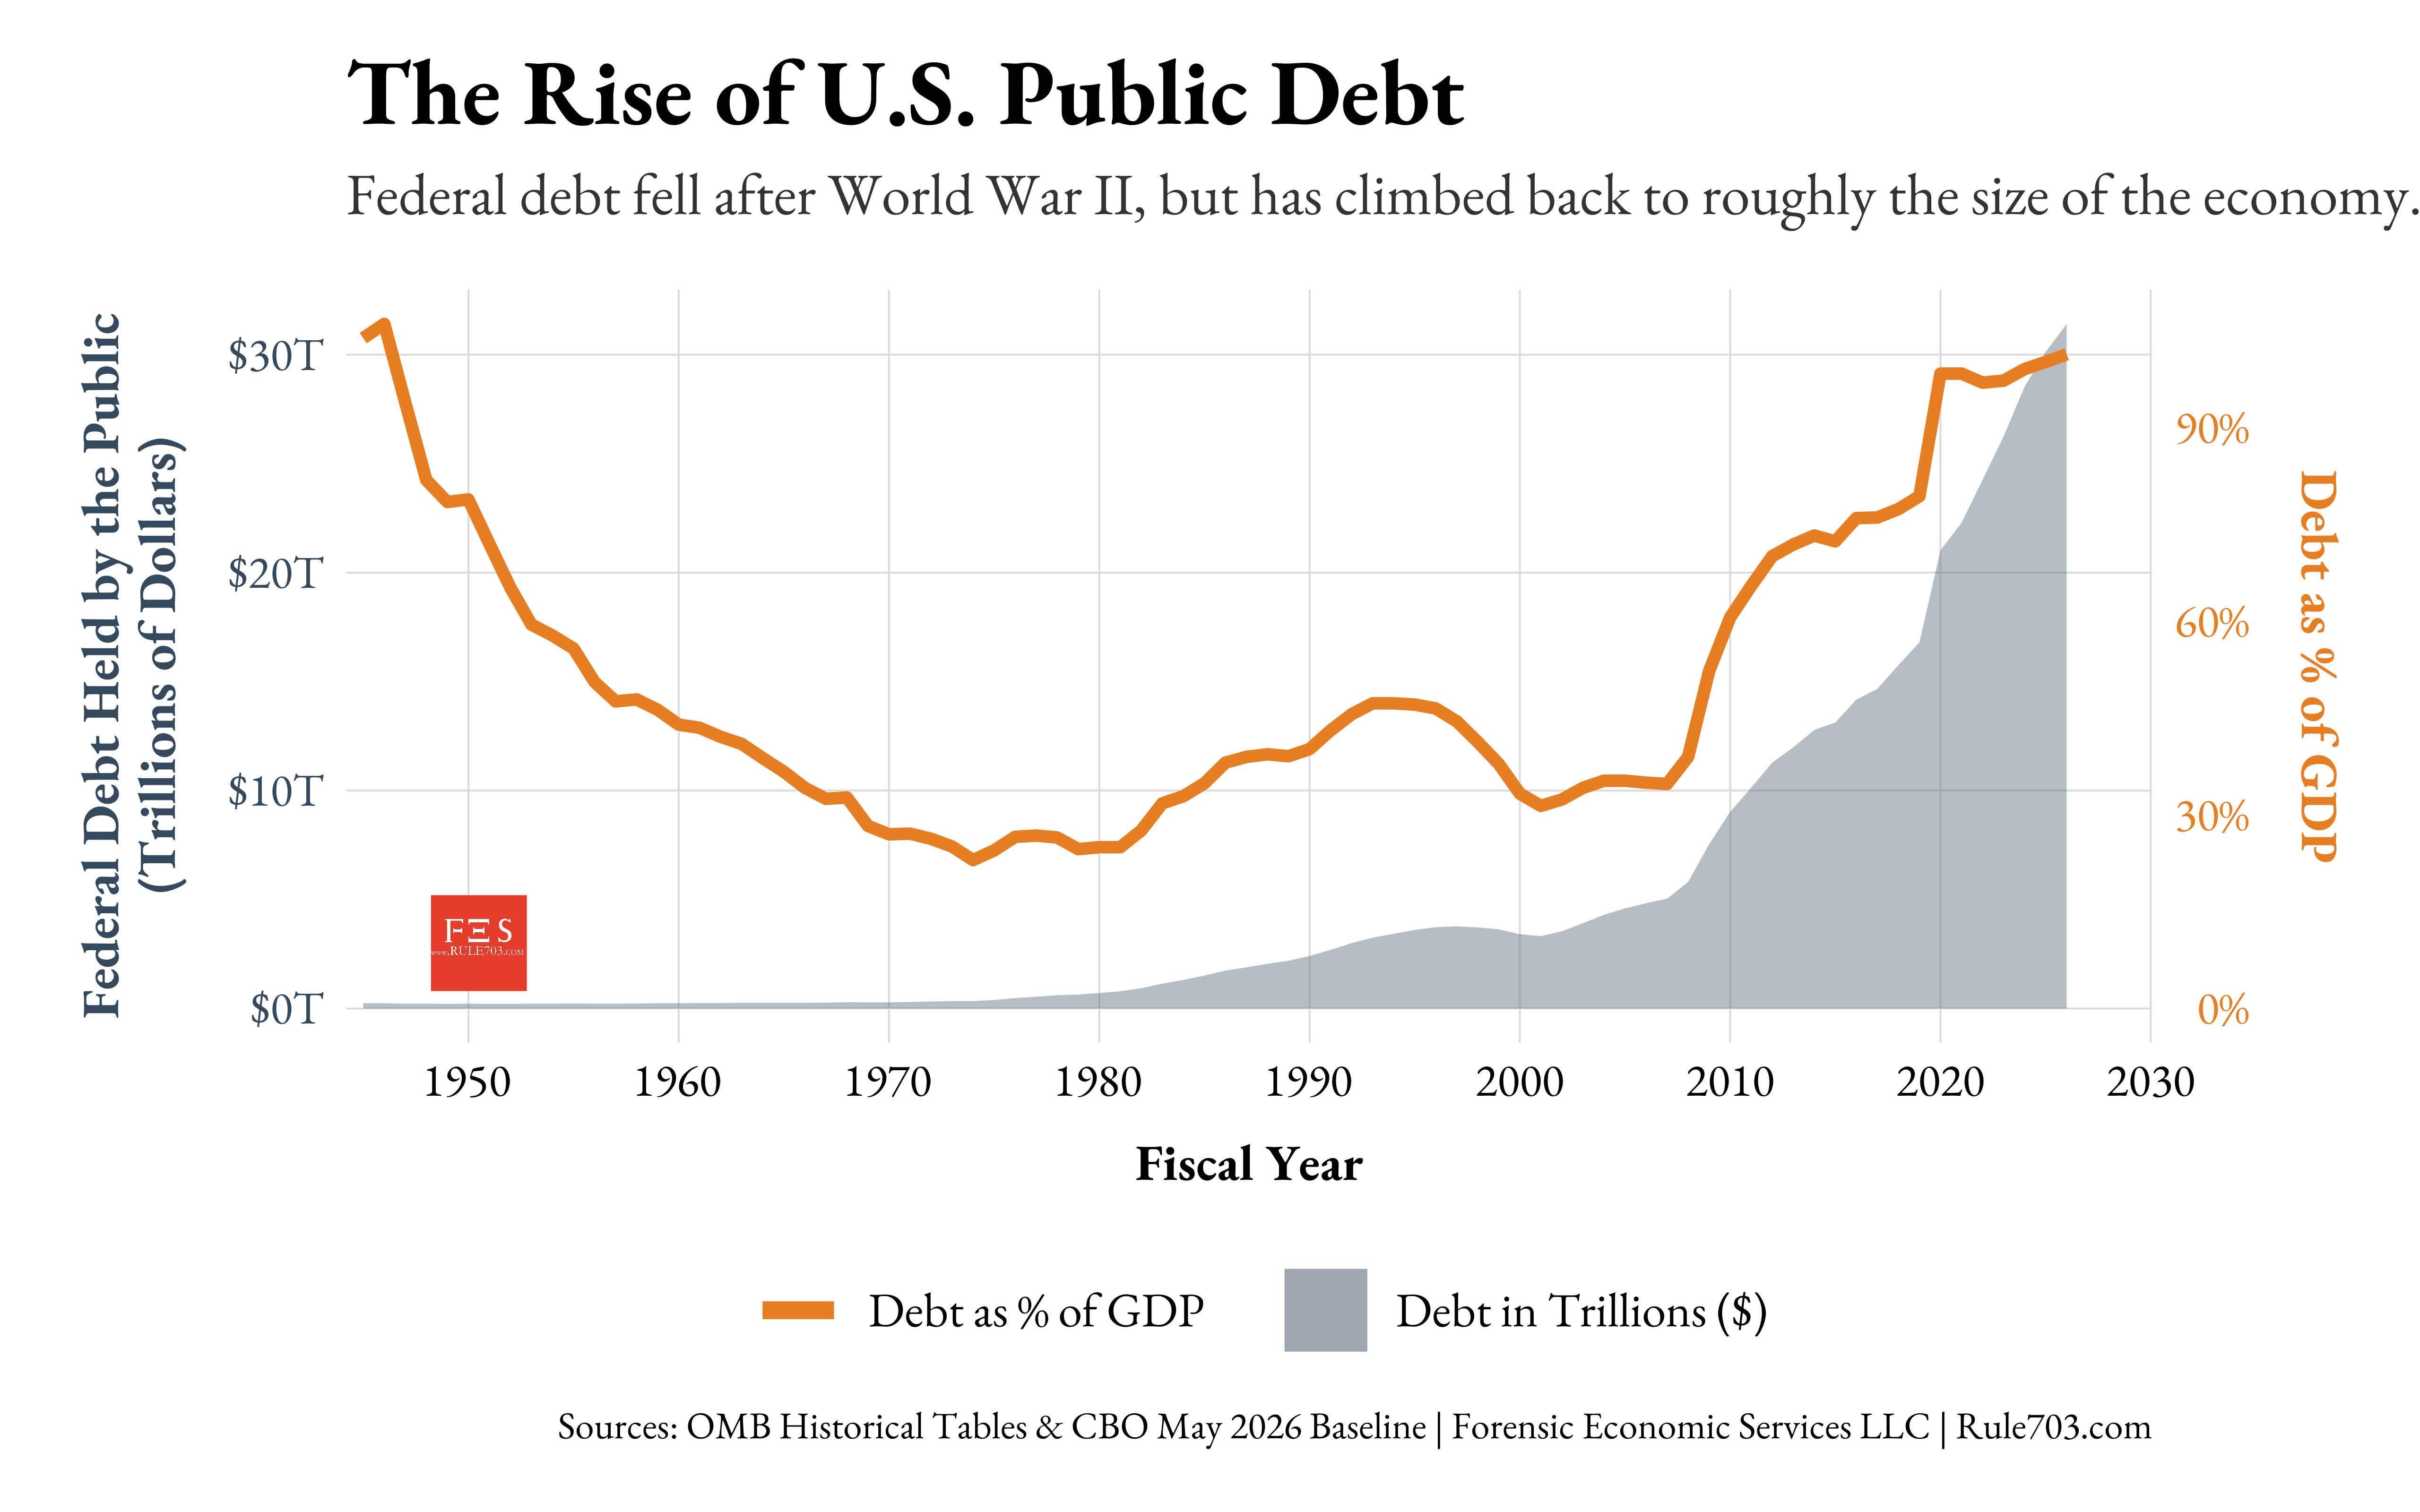
Created a long-run visualization of U.S. federal debt held by the public from 1945–2026, shown both in trillions of dollars and as a percentage of GDP.
A lot of the recent debate has focused on the debt ceiling and fiscal sustainability, but economists generally care more about the trajectory of debt relative to GDP, interest costs, and long-run growth than any single headline number.
We look forward to hearing your feedback.
by forensiceconomics
6 Comments
This autumn is going to be fireworks.
yeah its been that way for a while? the US has nearly 40 trillion in debt and 32 trillion gdp
How much of the state budget is spent on interest?
Sounds like we need to spend even more on ICE and the military industrial complex to fix this!
I can see Reagan from up here!
Genuine question: what did we even spend all of that money on since 2008? We exponentially blew up our debt and have what to show for it?