
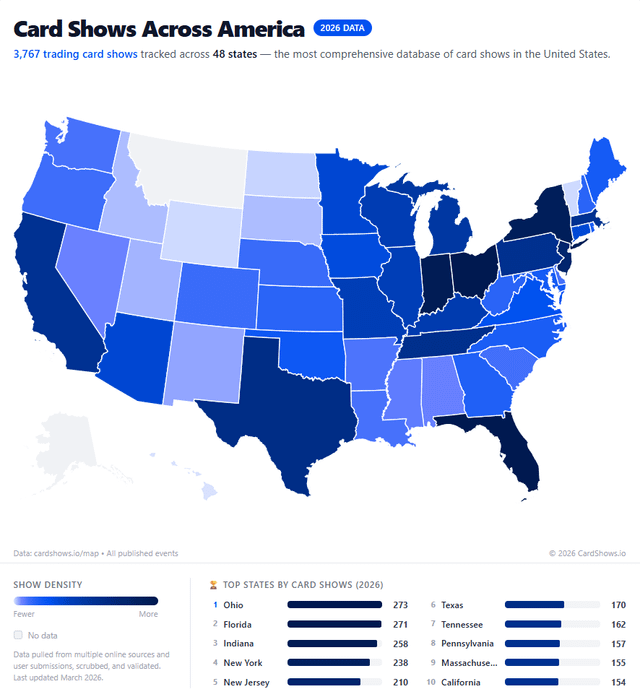
I’ve been aggregating US card shows (Pokemon, sports, etc) for a hobby project and decided to cross-reference the number of shows with the regional website traffic as a proxy for state-level interest in the hobby. The results are pretty interesting!
Takeaways
-
Ohio is king, which is pretty insane density compared to a state like California at #10.
-
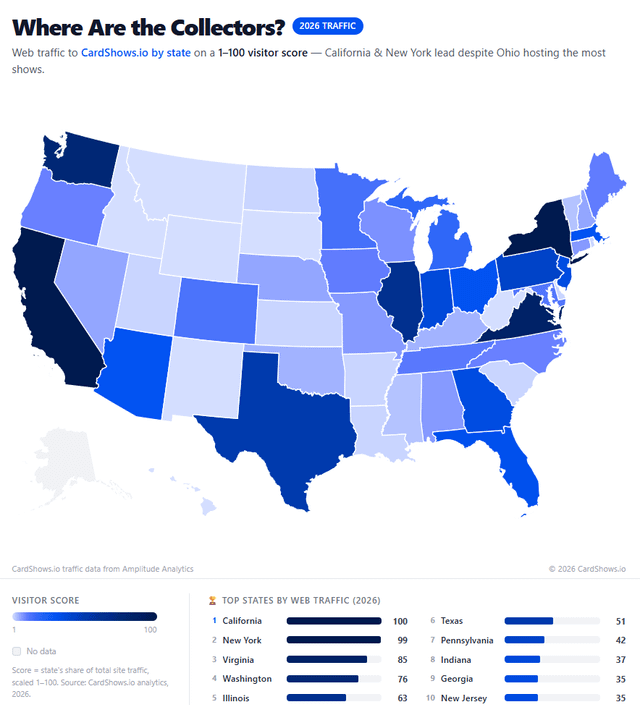
California (my home state) is #1 for web traffic, even though it's at #10 in show density. Every card show I go to is shoulder to shoulder, so I'm not too surprised.
-
Massive gaps in VA and WA. They're in the top 5 for traffic, but don't crack the top 10 for shows. Are shows more crowded in these states?
-
The bottom 5 states by show density: Alaska (0), Montana (0), Hawaii (1), Vermont (2), Wyoming (2). Is there anyone from these states who has been to a card show this year?
-
The bottom 5 states by web traffic from a score of 1-100: Idaho, Montana, South Dakota, New Mexico, Wyoming. All scored a 1 out of 100.
For the nerds
I built the interactive map (and website) using Claude Code entirely. It helped me pull card show + state data from my own website's Supabase tables, call my Amplitude data for page views from all US cities, then convert page views to a 1-100 scale. This data set isn't exhaustive. The site aggregates from event organizer sites, other directories, and user submissions. I'm sure I'm missing the smaller trade nights, but I think this is a pretty good sample size.
You can find the interactive maps here. Each state has a hover-effect with the actual number of shows and visitor score.
Hope you enjoy!
by aStroke
4 Comments
# For the nerds
I built the interactive map (and website) using Claude Code entirely. It helped me pull card show + state data from my own website’s Supabase tables, call my Amplitude data for page views from all US cities, then convert page views to a 1-100 scale. This data set isn’t exhaustive. The site aggregates from event organizer sites, other directories, and user submissions. I’m sure I’m missing the smaller trade nights, but I think this is a pretty good sample size.
You can find the interactive maps [here](https://cardshows.io/map). Each state has a hover-effect with the actual number of shows and visitor score.
Hope you enjoy!
It’s not quite perfect but a lot of this is r/peopleliveincities
This could be one map with one piece of data as the numerator and the other as the denominator. Shows/interest would be essentially a proxy version of ‘per capita’ for TCG. This is the analysis you do in your Takeaways, but the map could allow people to do it themselves without having to read your bullets. I like your approach, just take it one step further next time.
passionate nerds are the greatest thing humanity has to offer