
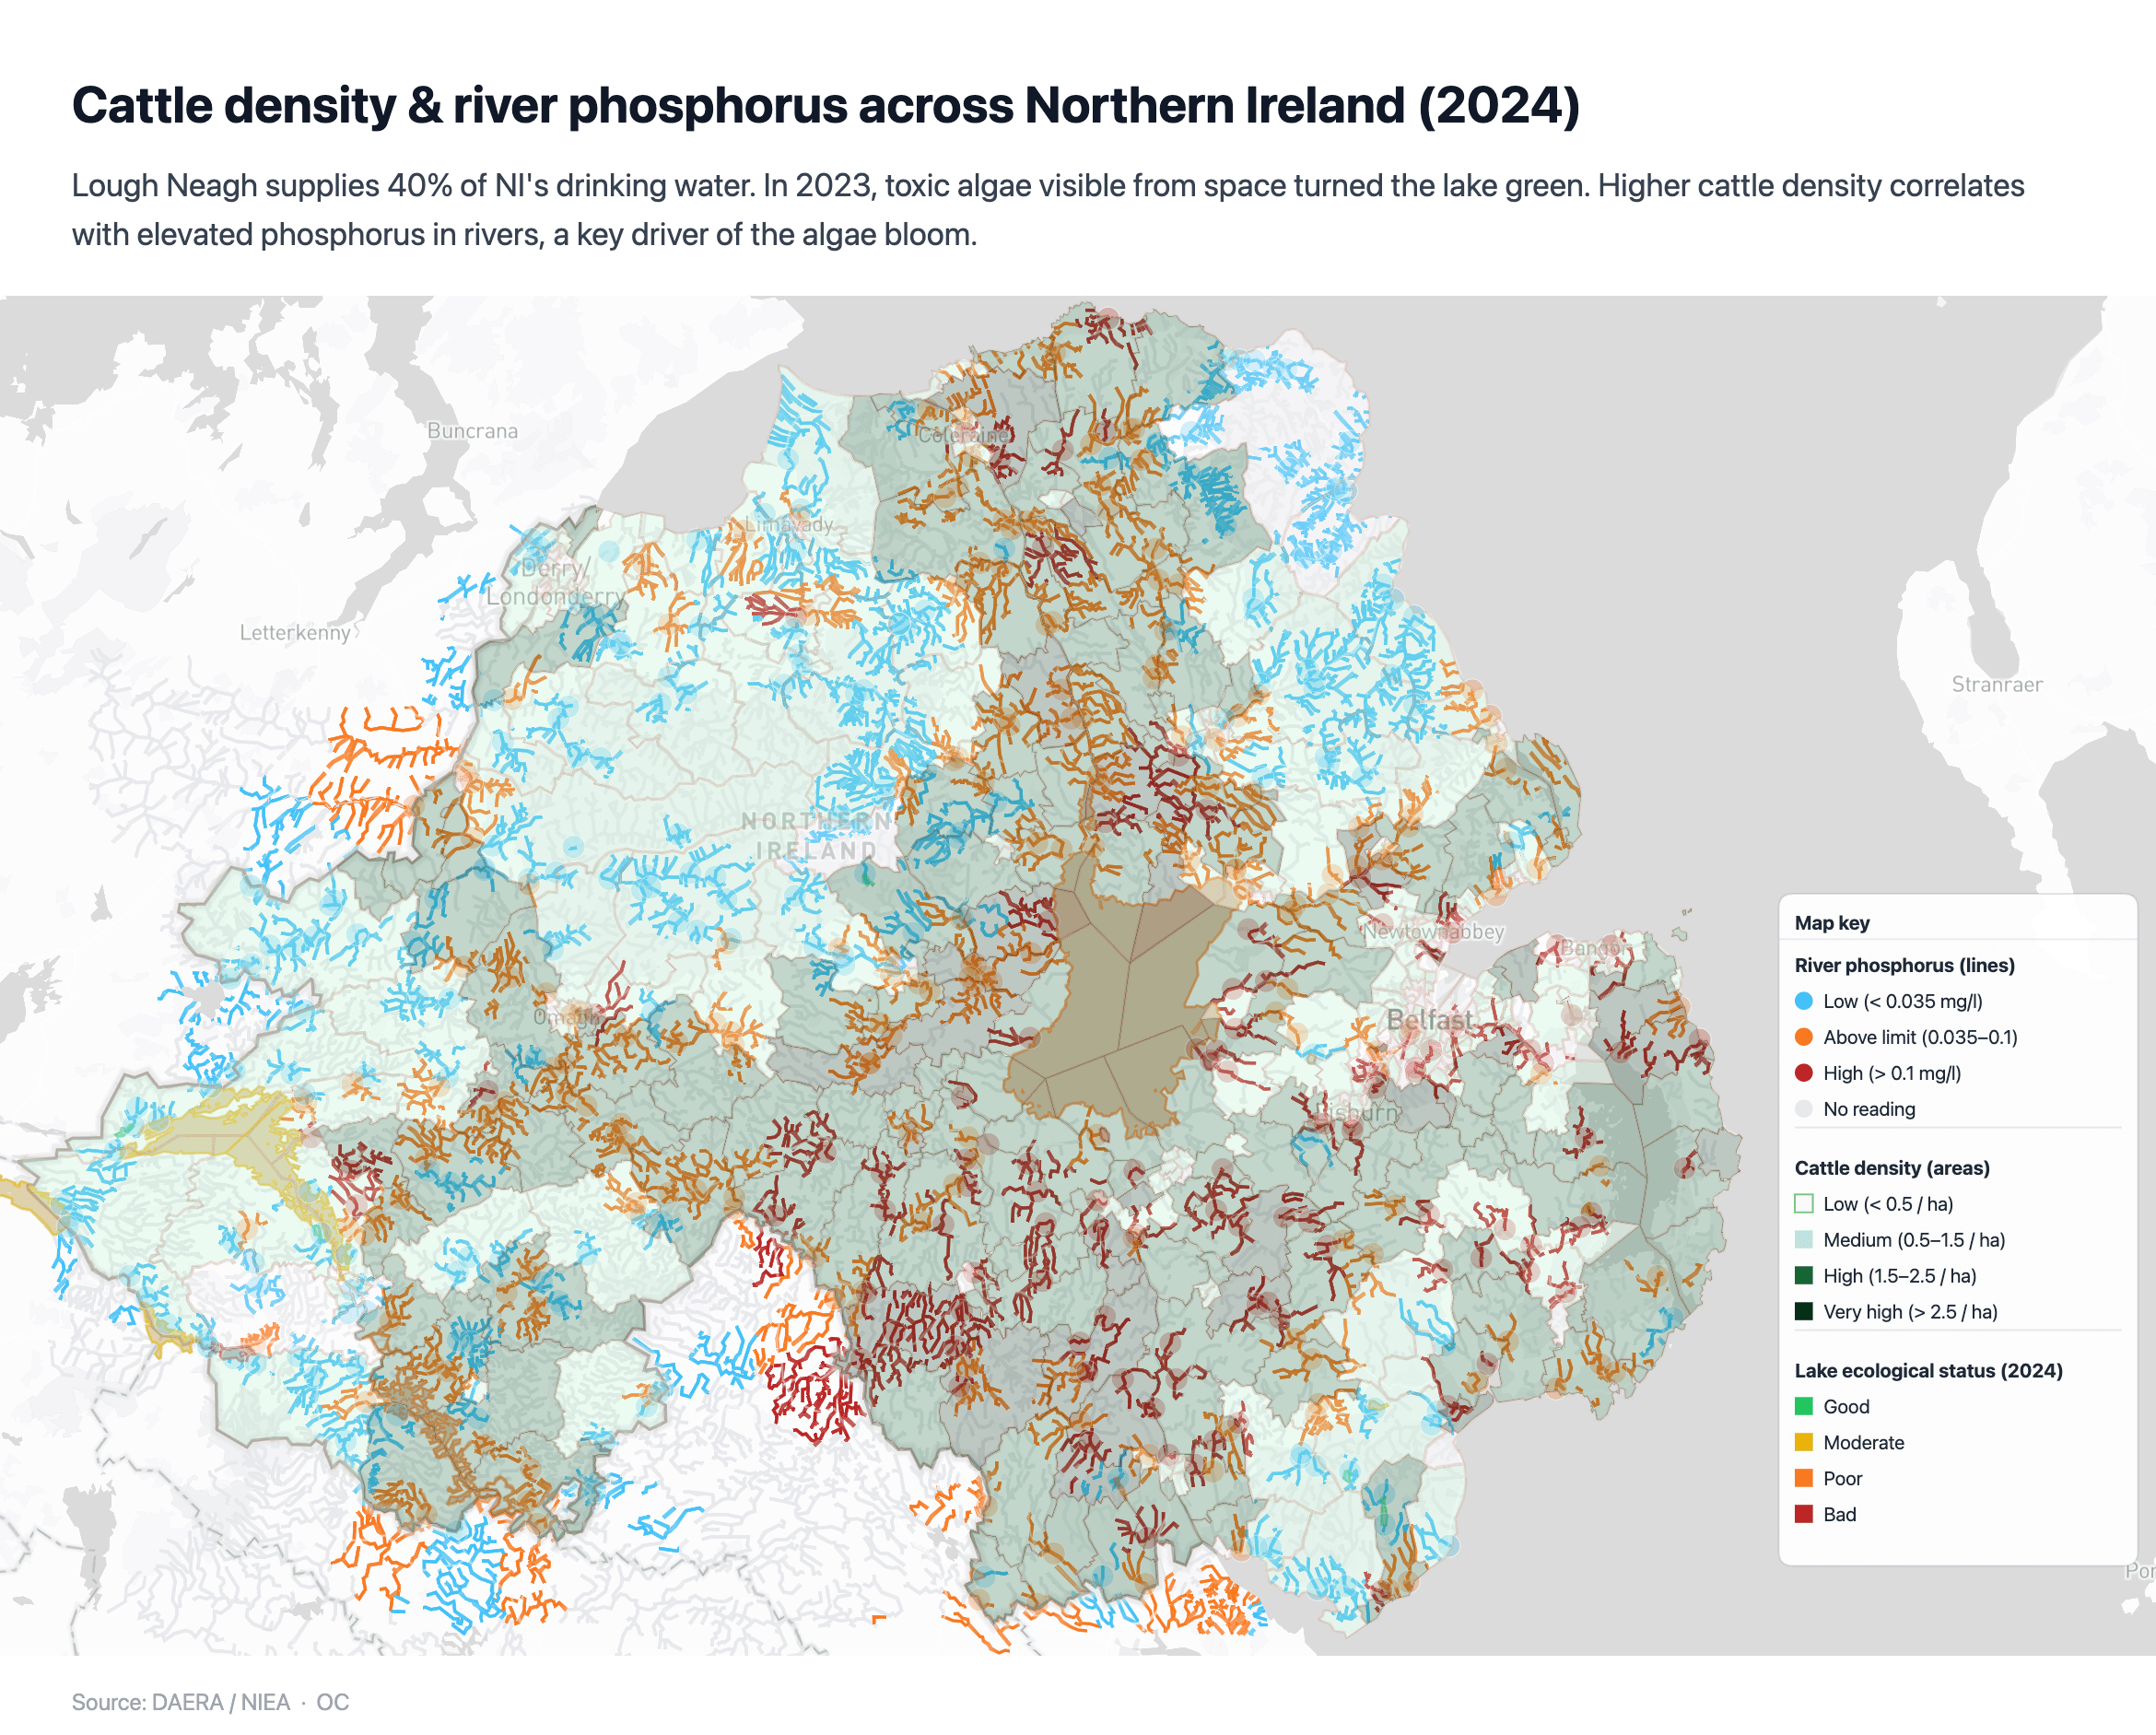
Visualising the intersection of agriculture and water quality in Northern Ireland. Using Mapbox GL JS and React, I’ve mapped cattle density (polygons) against soluble reactive phosphorus levels (lines) to highlight the pressure on the Lough Neagh catchment.
I created a full interactive dashboard supports historical time-series data and spatial exploration, available here – https://rivers.climategapni.com
Any feedback would be much appreciated!
by Few-Philosopher4327
1 Comment
**Data**
River phosphorus: NIEA (Northern Ireland Environment Agency) water quality monitoring network. Metric: Soluble Reactive Phosphorus (P(SOL)), 5-year rolling mean of annual averages. The legal threshold shown is the Water Framework Directive limit of 0.035 mg/l, above which a waterbody cannot achieve Good Ecological Status. ~70 monitoring stations, continuous record 1990–2024.
Cattle density: DAERA (Department of Agriculture, Environment and Rural Affairs) agricultural census, aggregated to District Electoral Area (DEA) level. Expressed as cattle per hectare. Available 2015–2024.
Lake ecological status: WFD classification, 2024 assessment cycle (NIEA).
**Tools**
React 18, TypeScript, Mapbox GL JS 3, react-map-gl, FastAPI, PostgreSQL + PostGIS