
After my previous post on passive voice and hedging by news topic, I looked at the same idea at the outlet level. So I ran the same style of metadata-only linguistic analysis across 8 news outlets from 2016–2026.
The two metrics shown are:
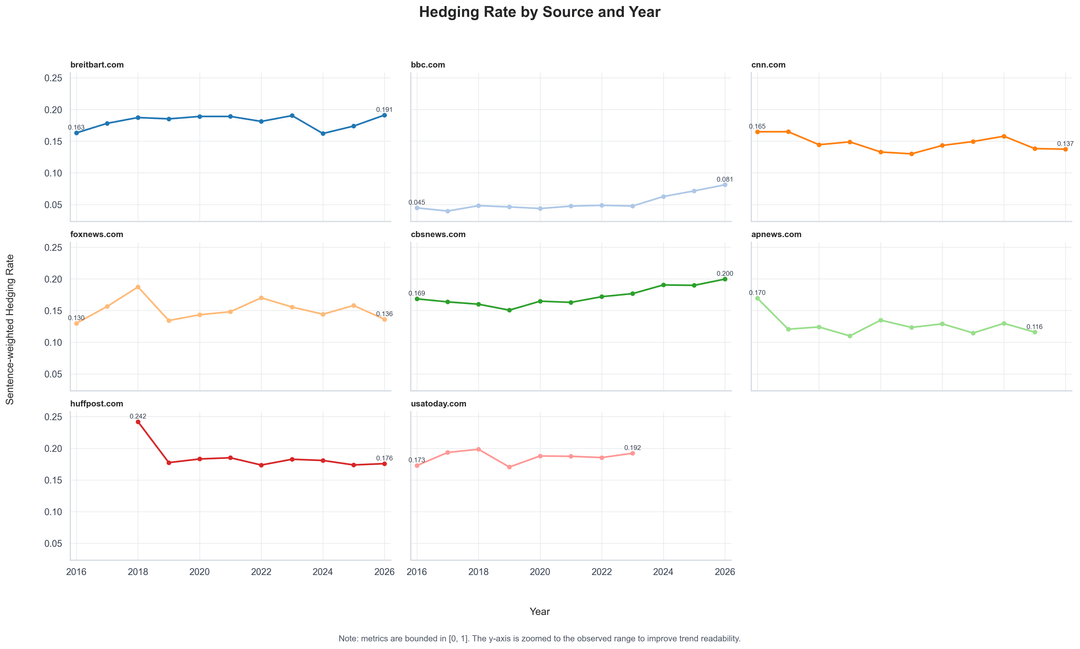
Hedging Rate: Share of sentences containing uncertainty/speculative language, such as “may,” “might,” “could,” “reportedly,” or “allegedly.”
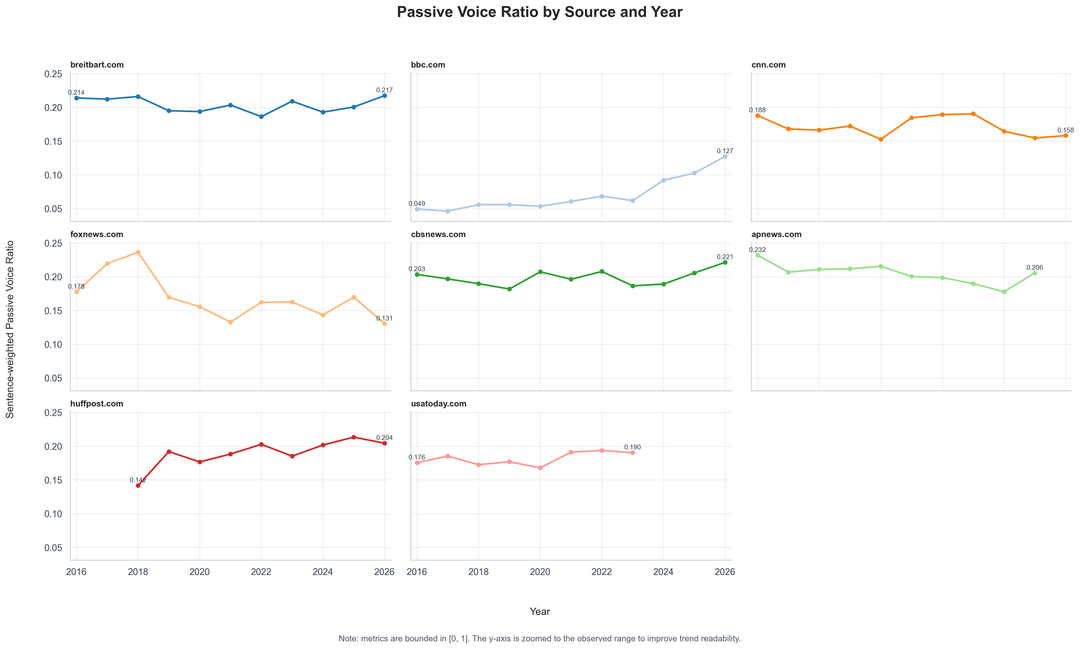
Passive Voice Ratio: Share of sentences detected as passive voice, used here as a rough signal for less direct agency/attribution structure.
The analysis is filtered to hard-news topics and excludes sports, entertainment, lifestyle, weather, and similar categories.
Important caveats:
- This is not a truthfulness ranking.
- It measures linguistic style, not factual accuracy.
- Topic mix and article type can affect the results.
- Some source trend lines/panels cover fewer years because this sample applies minimum-per-year data thresholds and only plots years with sufficient observations.
- The y-axis is zoomed to the observed range; both metrics are bounded between 0 and 1.
A few visible patterns:
- BBC appears much lower on both metrics, though it rises in recent years.
- CBS News trends upward on both hedging and passive voice.
- AP News trends lower on hedging after 2016, while passive voice remains relatively high.
- Breitbart, HuffPost, and USA Today sit relatively high on hedging in this sample.
- Fox News is more volatile year to year, especially in earlier years.
Next, I can do sentiment extremism, attribution/quote ratio, headline-body alignment, or topic-adjusted outlet comparisons.
Which would be most useful?
by Queasy_System9168
1 Comment
**Data source:** This analysis is based on the larger internal Neutral News AI metadata corpus, which is the full version behind the public Kaggle sample dataset: [News Metadata Dataset (7K)](https://www.kaggle.com/datasets/neutralnewsai/nnai-news-metadata-dataset-7k). The public Kaggle version contains a 7,000-row metadata-only sample; this outlet-level analysis uses the broader underlying corpus to get source/year coverage.
**Tools used:** Python, pandas, spaCy for NLP feature extraction, and Seaborn/Matplotlib for visualization.
**Processing notes:**
* Full article text is not redistributed; the analysis uses derived metadata/NLP features.
* Articles were filtered to hard-news topics and exclude sports, entertainment, lifestyle, weather, and similar categories.
* Years with too few usable observations for a given source are not plotted.
* Metrics are sentence-weighted yearly averages by source.
* The y-axis is zoomed to the observed range for readability; both metrics are bounded between 0 and 1.
**Metric definitions:**
* **Hedging Rate:** share of sentences containing uncertainty/speculative language.
* **Passive Voice Ratio:** share of sentences detected as passive voice.