
Hey, I'm Ignacio, a data reporter at USA TODAY. With my team, we analyzed 70 years of weather data to compare how our current winters stack against those in the mid 1950s. Turns out, your grandpa was right: back in the day, winters were colder and longer.
Almost every single city we analyzed is experiencing fewer freezing days. Those are also starting later and ending much sooner. They also don’t get as cold.
Even if you’re not a fan of the cold season, this can disrupt so many things: water reserves, mosquito and tick spread, maple trees, and the culture and livelihoods from winter sports.
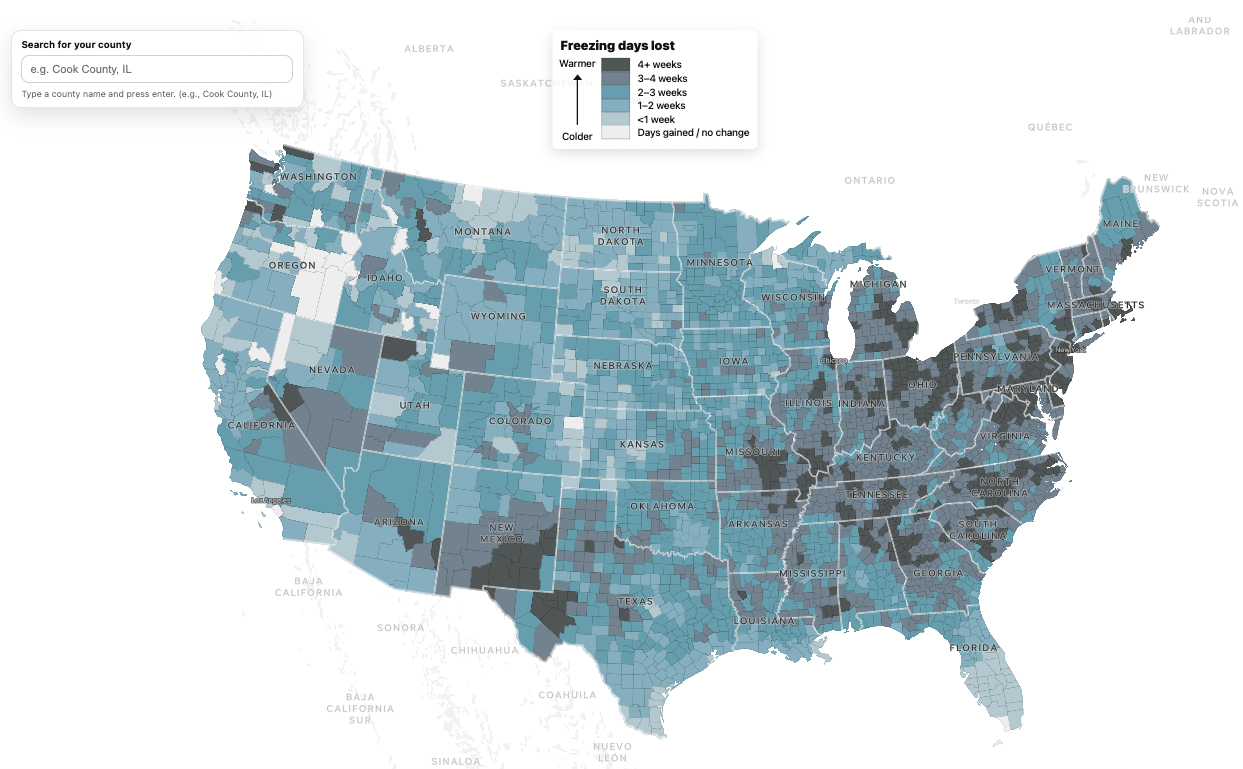
Wondering how your county is changing due to climate change? You can see that in our interactive map: https://www.usatoday.com/graphics/interactives/how-climate-change-is-impacting-winters/
And tell us how shorter winters are impacting you.
by usatoday
4 Comments
For this story, we used a daily temperature dataset from the National Oceanic and Atmospheric Administration called nClimGrid-Daily. It provides estimates for square areas about 5 kilometers wide (roughly 3 miles).
For every U.S. city or town with a population over 100,000, we used the data from the grid cell closest to its center. We then identified each day that the low temperature reached 32 degrees Fahrenheit or colder. We grouped these freezing days by “water year,” which runs from Oct. 1 through Sept. 30 of the following year (think of it as the fiscal year used in climate and water research). For each city and year (1956-2025), we measured several indicators: the total number of freezing days, the first and last freezing day of the season, the longest stretch of consecutive freezing days, and the coldest temperature recorded.
To understand how these measures have changed over time, we ran linear regressions for all cities that had sufficient data, which we defined as at least one freezing day in at least half the years – mirroring methods used by Climate Central and other researchers. This approach helps distinguish long-term changes from natural year‑to‑year variability.
We also tested whether the trends were statistically significant. We repeated a similar analysis at the county level. Counties that do not experience freezes every year were included to allow for broader exploration of the data. You can read a full description of our methods and find our code on GitHub. – Ignacio from USA TODAY
What happened to Virginia Beach?
Ooooh look at the overachievers Canada and Mexico keeping their climate stable.
https://www.usatoday.com/graphics/interactives/how-climate-change-is-impacting-winters/