
This is an update of a project I posted here not to long ago. Added election layers, design tweaks, EV data, school distribution etc.
Please, check it out: https://onehundredviewsofberlin.itsbor.is/
For ones who missed the previous post, this is the broader explanation:
—
I moved to Berlin recently and did what a reasonable person does – I started digging through the city's open data.
Berlin actually has a lot of publicly available data. The problem is it's scattered across different sources, sometimes outdated, and the official visualisations look like they were made in 1995.
So I built this:
https://onehundredviewsofberlin.itsbor.is/
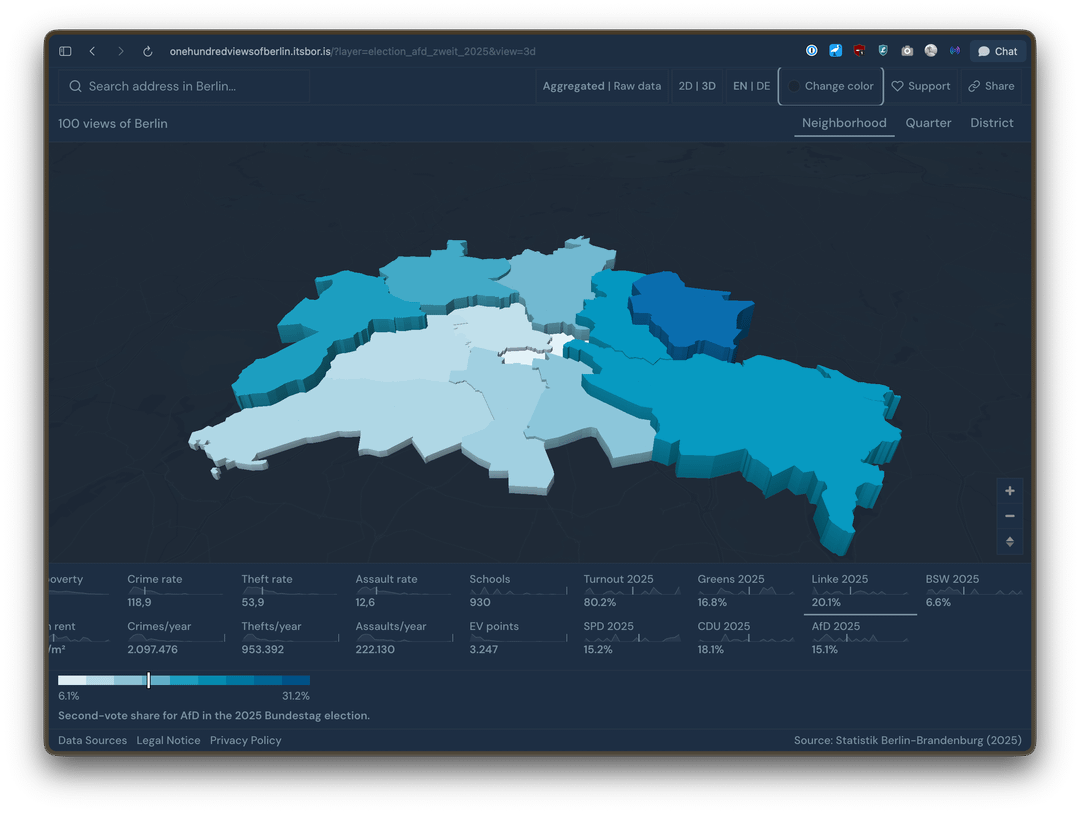
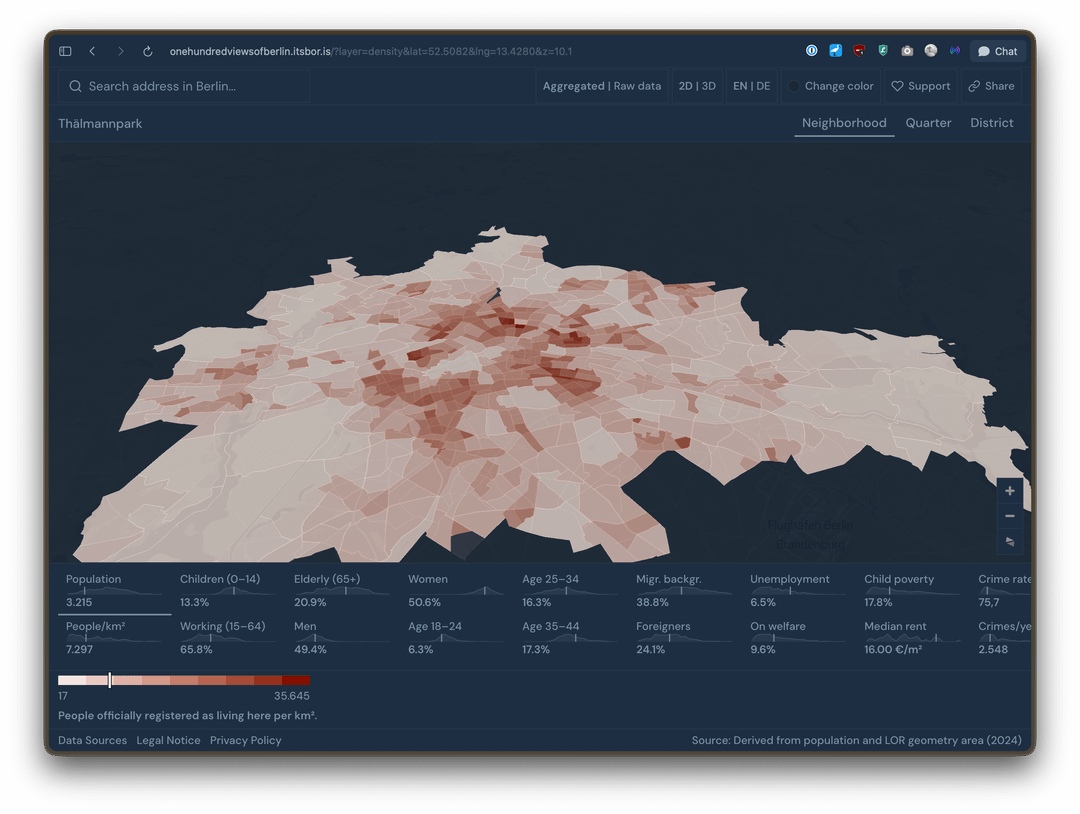
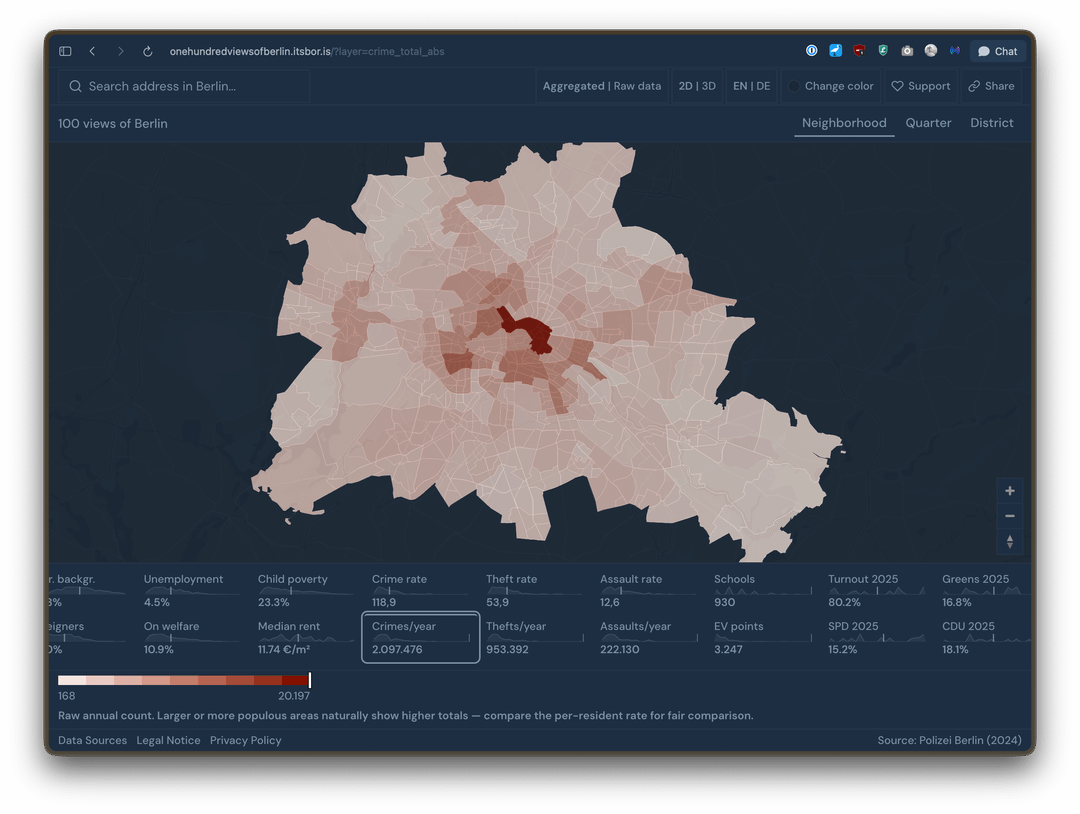
You can explore at three levels of details, and if you click on a data label you'll see its own distribution.
About 30 indicators total: last election results, crime rates, rent, unemployment, child poverty, demographics, migration background, age distribution, EV charging, schools, etc.
Some notes:
– There are probably bugs. Please, tell me if you find one.
– And if you're a native German speaker and/or a Berliner, please tell me whether it all makes sense to you, or something looks off
I also have a lot more data collected and plan to add it later, maybe.
I'll be happy if you react and share your thoughts.
by lllllbbbbbkkkk
1 Comment
It’s gorgeous. What tools did you use? Is it all from scratch or do you recommend some tools and libraries (I’m a developer too).