

I built a small system that turns raw site analytics into a living story.
It started as a personal checklist tool, but once it went public, I wanted to understand how people actually used it without digging through dashboards or static charts.
So instead of traditional analytics, I built a pipeline:
raw visit data > structured metrics > generative AI > narrative.
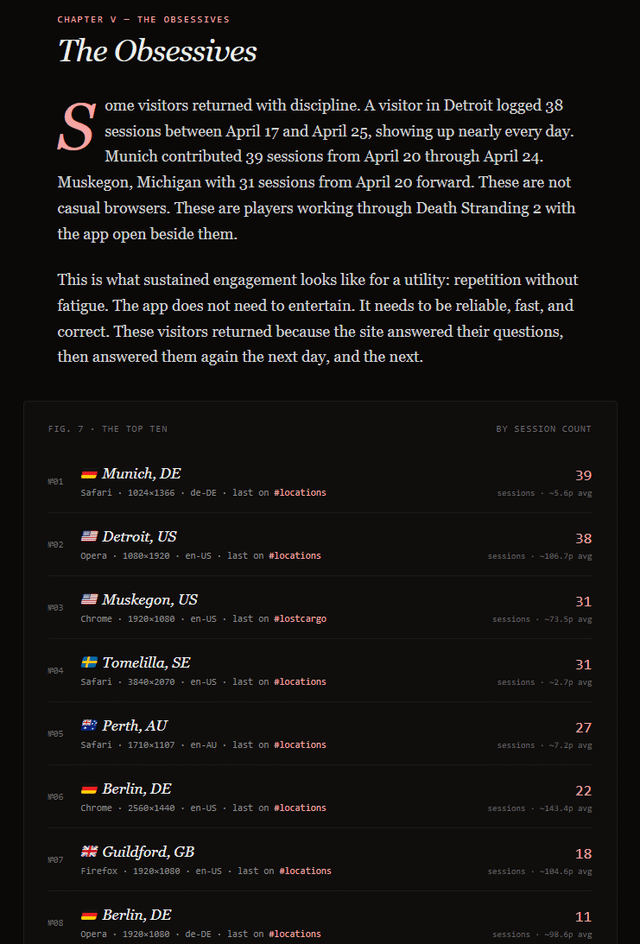
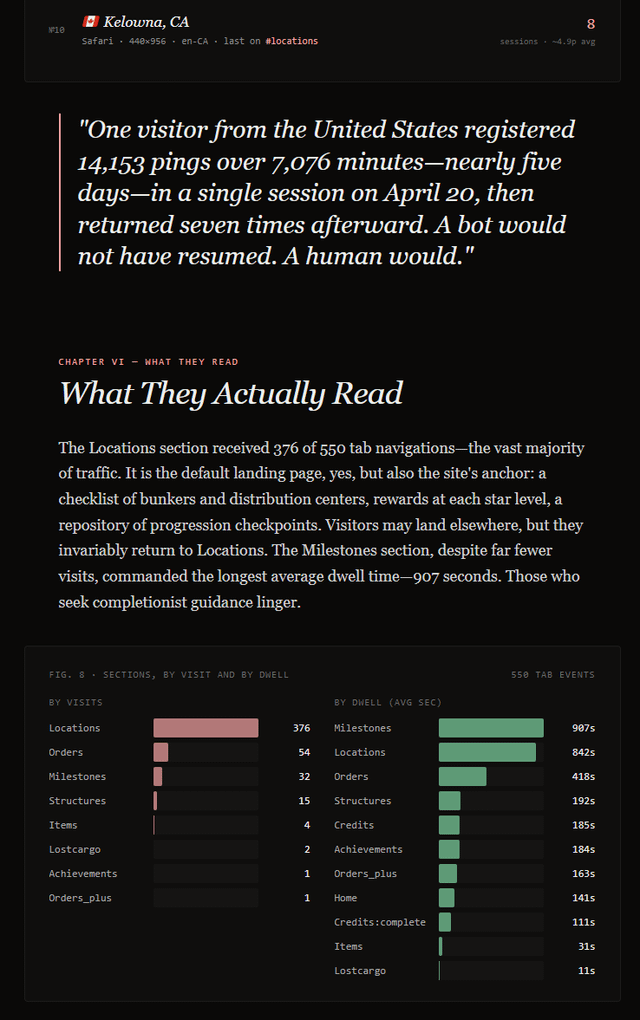
Using Claude Haiku, the system interprets the data and writes an editorial-style story of what’s happening: where users come from, how they behave, what patterns emerge. Each refresh regenerates the story entirely, making the page a dynamic, living system of data-driven narrative rather than a fixed report.
The result is not just “stats”, but a continuously evolving explanation of usage that I can just pick up and read to gain insights into how the site is doing, and how it is being used. Something saving me time spent on constantly finding potential changes in the usage patterns by having to query my database over and over in order to reveal those patterns.. or trying to deduce patterns from my data charts page (which is separate and not included here, as it is less interesting).
What do you think about the idea, and is there anything you would have done differently?
by Luggruff
2 Comments
**Data sources:** My own data collected for a website I built.
**Tools used:** Claude code for story structure utilizing PHP and React. Claude Haiku used to interpret visitor database tables and write the story narrative with a subset of rules and information (mainly a description of the site functionality and information about the game)
……….can you possibly dumb this down and ELI5 what any of this means?
… It sounds like it could actually be really interesting but sadly I am probably several intelligence levels lower than your main target audience for this post, lol 😭. Please translate