
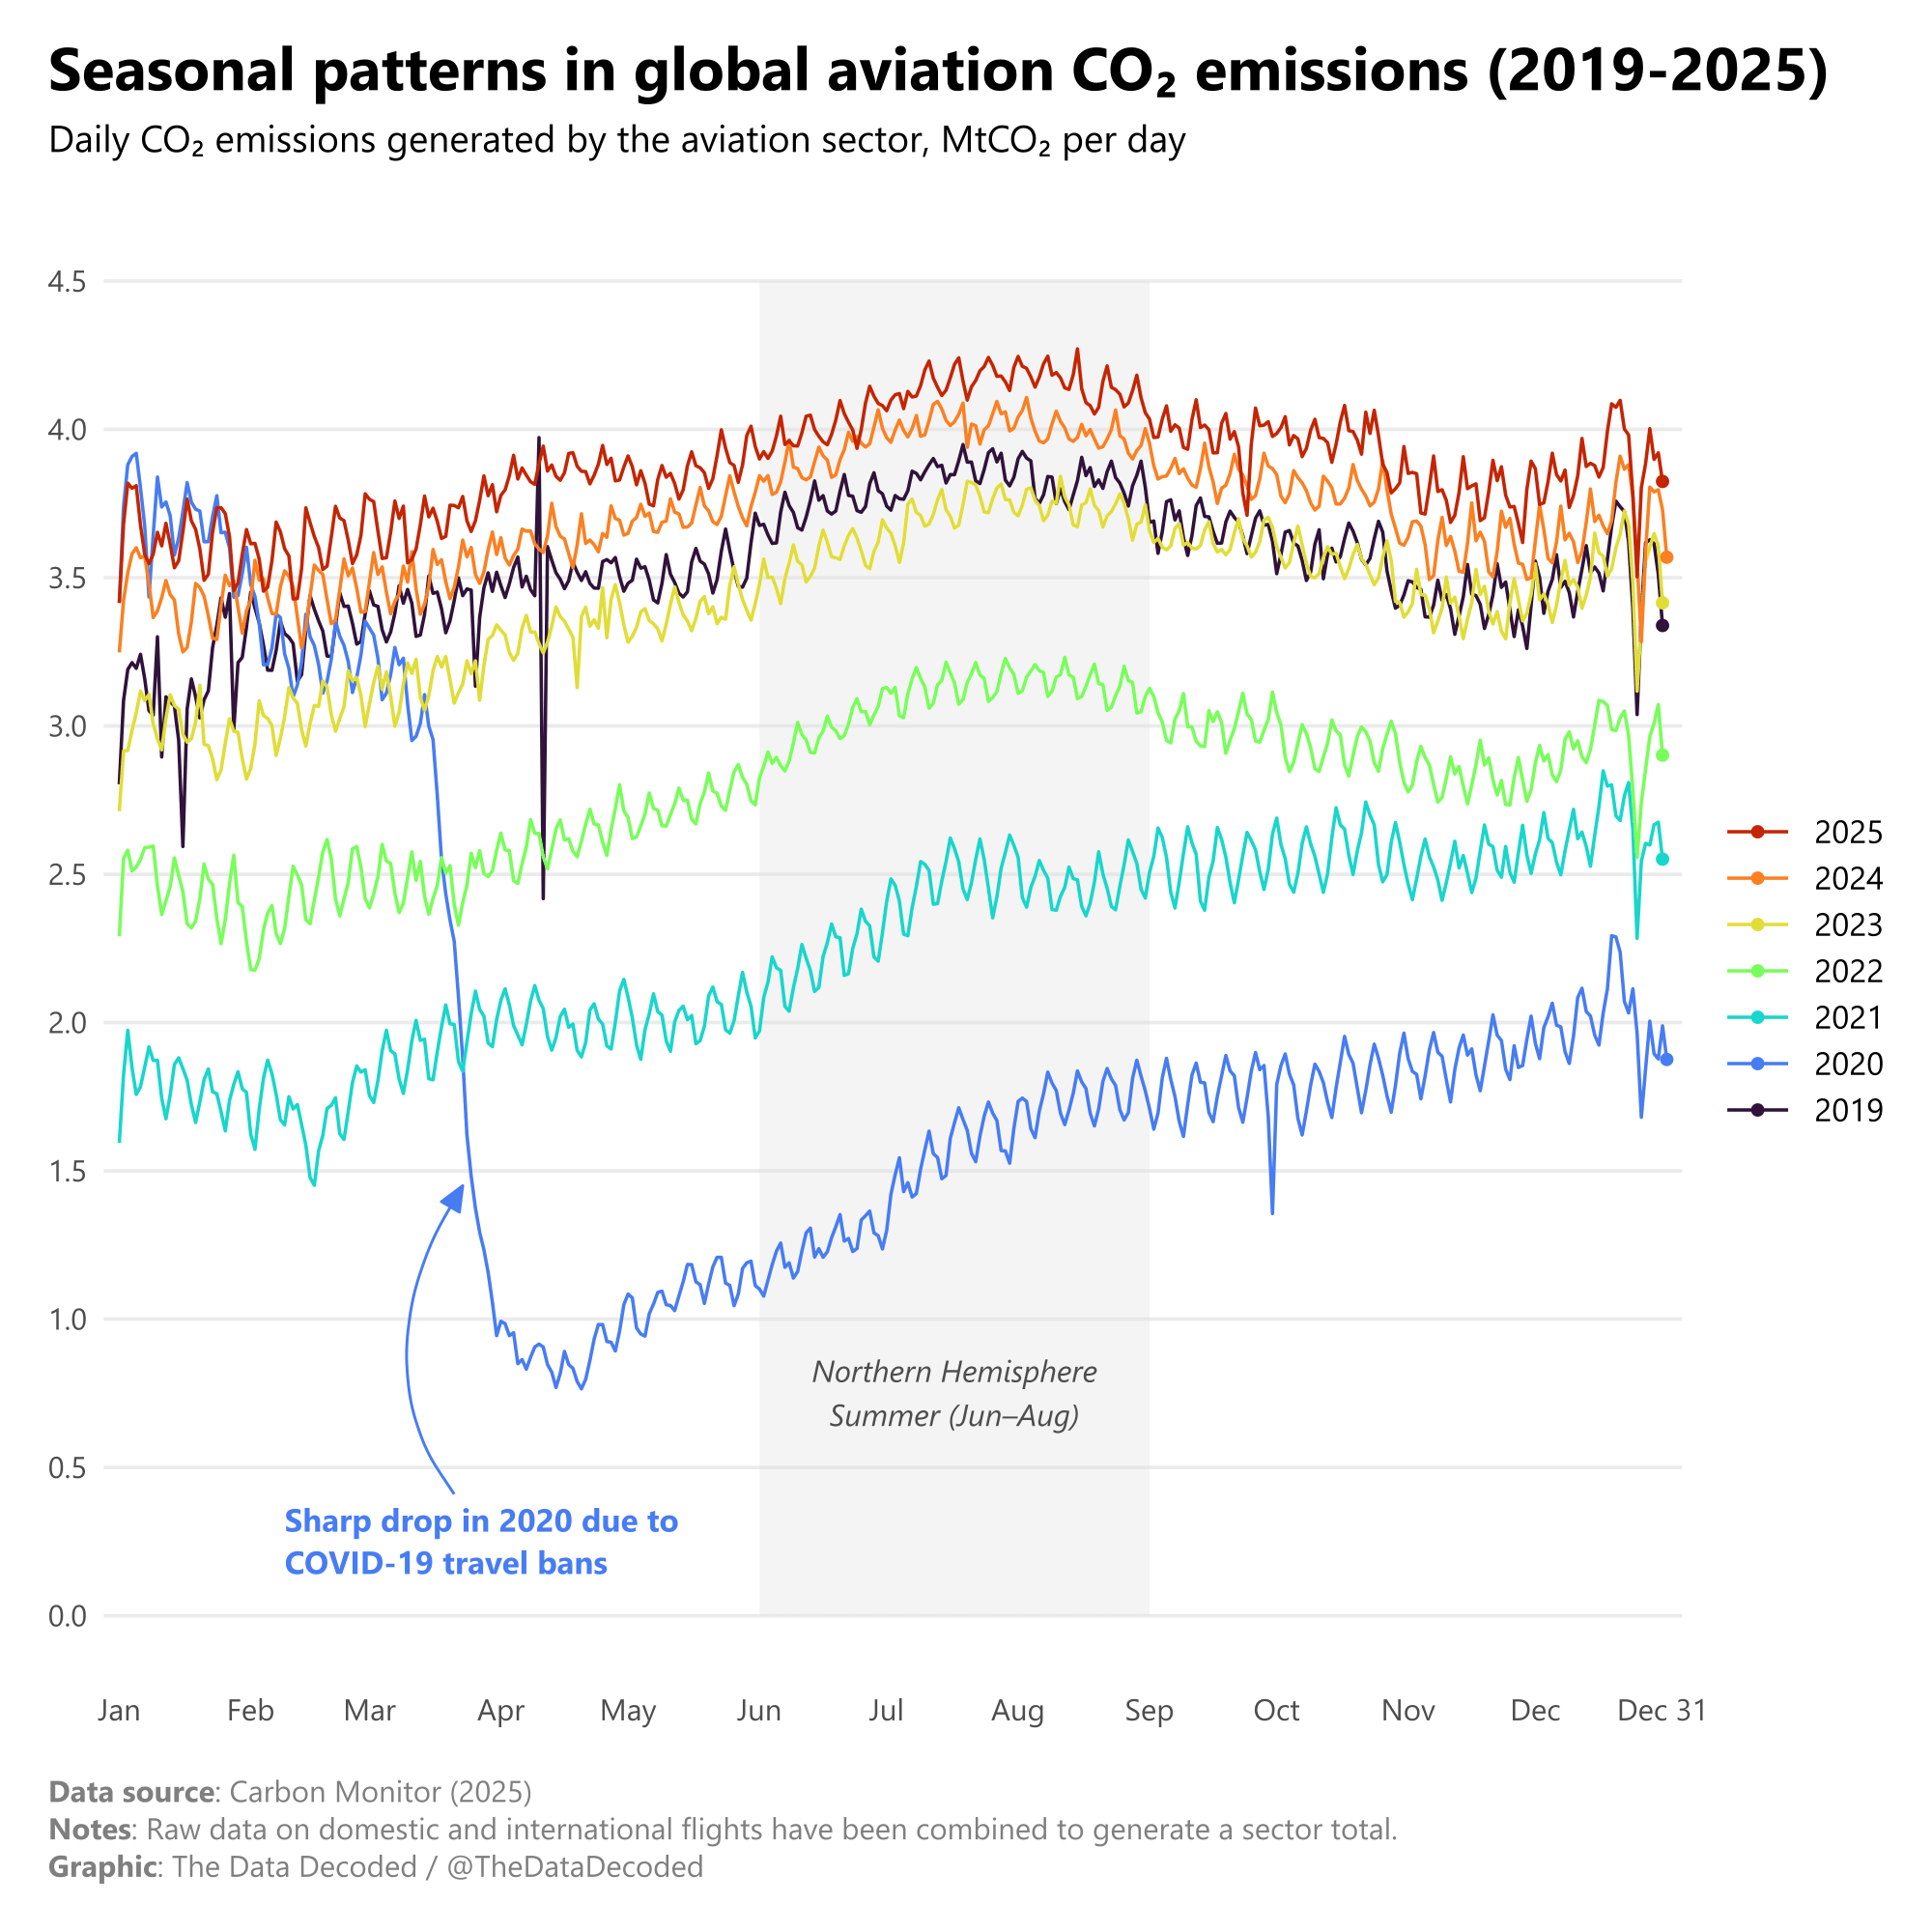
In continuation to yesterday's post (link here), I look at the seasonality of global aviation CO₂ emissions during each year between 2019 and 2025.
Strong seasonal summer peaks gradually re-emerged during the post-pandemic recovery. These peaks are generally driven by Northern Hemisphere holiday travel. The pattern here closely matches the trends seen in the tourism and accommodation sector.
by Low-Car6464
6 Comments
**Data source**: Carbon Monitor (2025)
**Tools used**: R (ggplot2, dplyr), RStudio
wondering what happened in april 2019? and also what caused the drop at the start of October 2020?
and what keeps causing an increase in production of co2?
Could be better as a chart. This is not a very easy to read chart. Hard to match the legend to the matching line. The message of the chart is not very clear.
Yesterday’s was a better chart.
Already moved past pre-covid levels.
If you normalized data by km traveled per passenger, would the trend be going down? or stable? (i.e. are planes still eking out efficiency gains? or have they gotten about as efficient as they can get? or are airlines packing more people in each plane?).
rando related question–the airline industry always talks about biofuels …is there any progress on that front, or is it just hopeful greenwashing that will always be 20 years in the future?