
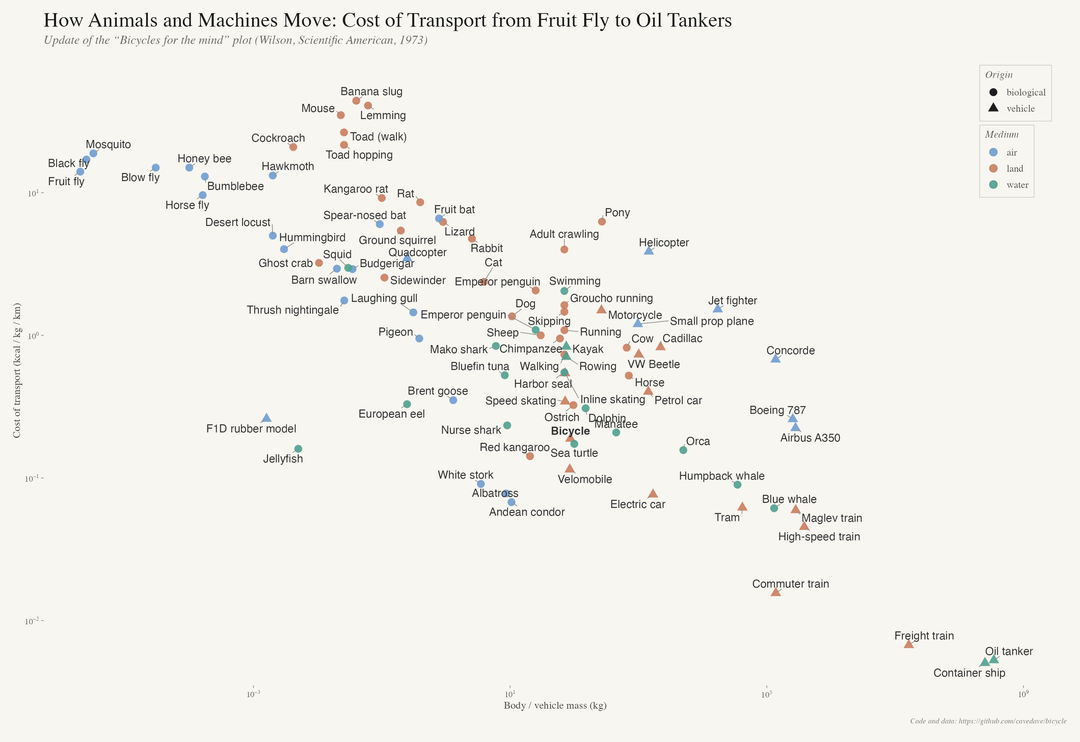
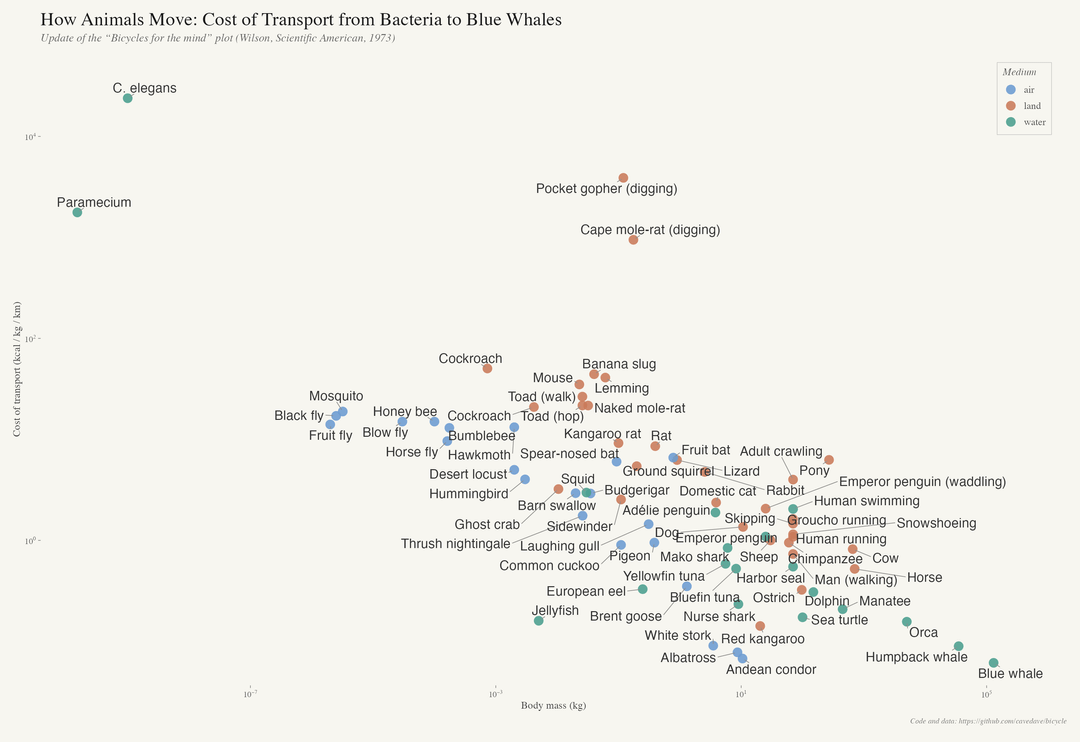
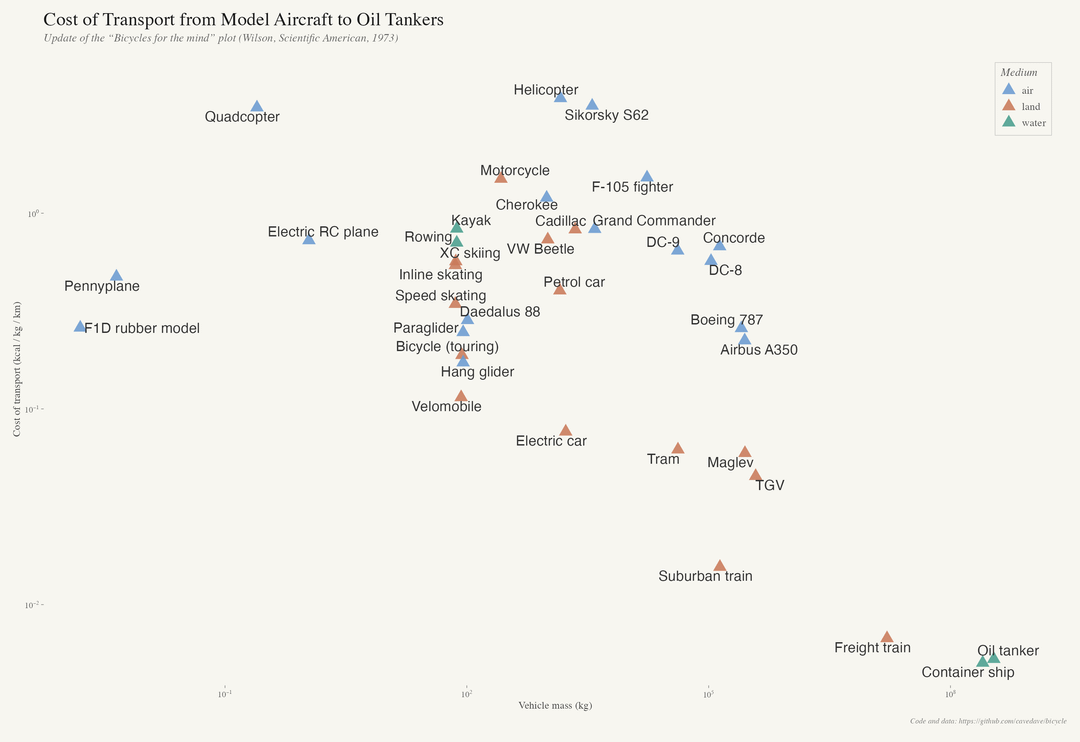
Steve Job's favorite graph was one that showed how efficient bicycles are. He called the computer the bicycle for the mind. That graph was made by Wilson in 1973 so i decided to update it.
R Package ggplot2 code and all the data which comes from loads of scientific papers are on github here There will be mistakes and omissions in this much data. If you find them I will correct them. I do not know that much about e coli, rubber band planes, oil tankers and Emperor penguins and also I made this for fun no one is paying me. If you have a friend who knows a lot about Groucho Marx running, e coli, penguins, bicycle planes or whatever please send it to them as they can correct things.
by cavedave
2 Comments
R Package ggplot2 code and all the data which comes from loads of scientific papers are on github [here](https://github.com/cavedave/bicycle/tree/main).
More on the original graph here [https://medium.com/@jennyabramov/the-computer-is-the-bicycle-of-the-mind-405c5242bcdb](https://medium.com/@jennyabramov/the-computer-is-the-bicycle-of-the-mind-405c5242bcdb)
if the object (animal of vehicle) is off-diagonal, it show its efficiency.
What the metric? can one plot the off-diagonal metric?