
[OC] Forensic Analysis of CA Daily 3 Variance
Data Source: Scraped from the California Lottery Public API (JSON) via Python.
Tools Used:
ETL/Data Cleaning: Python (Pandas/Requests)
Mathematical Analysis: First-order Markov Chain Transition Modeling
Visualization: Python (Matplotlib/Seaborn) with a 'mako' color mapping.
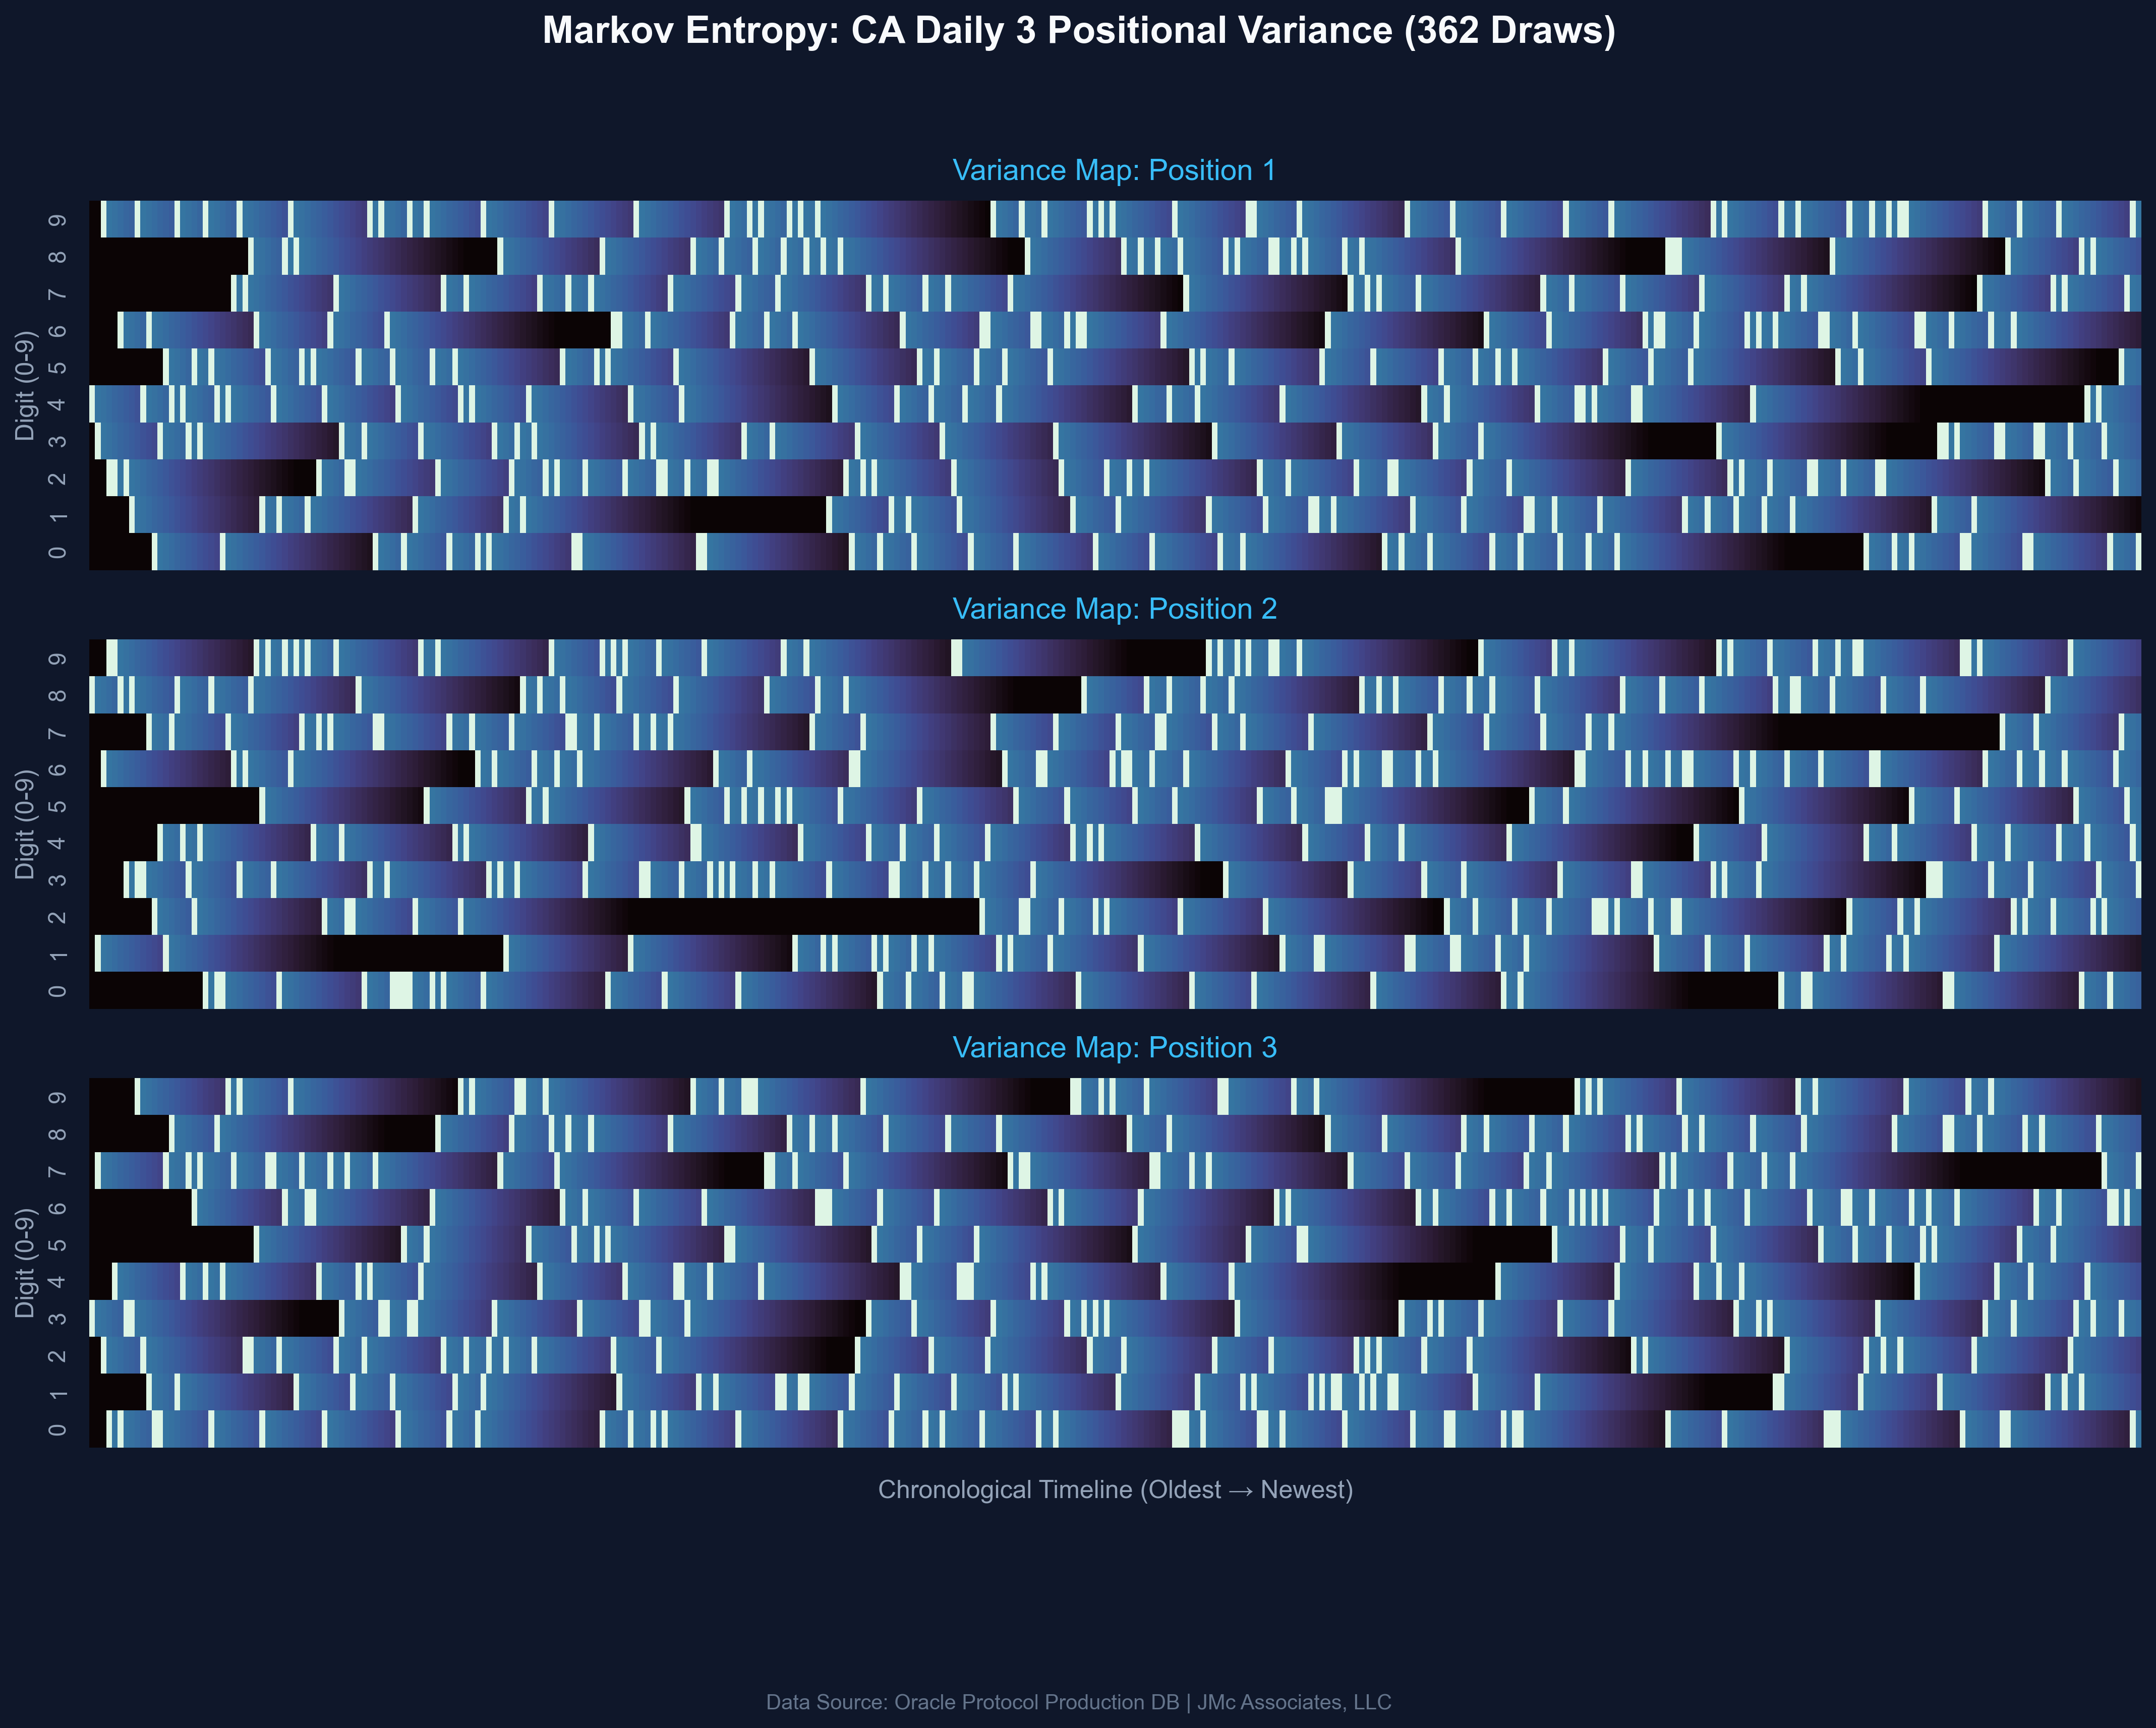
The visualization maps the "decay" of each digit (0-9) across the three draw positions over the last 365 draws. Brighter blocks indicate a hit; darker voids represent "Dead Zones" where specific digits have failed to materialize for extended periods. The goal is to visually demonstrate how standard variance creates persistent gaps that the human mind incorrectly labels as "due."
by ModernCYPH3R
1 Comment
I’m a Solutions Architect who occasionally dips into data engineering when a problem annoys me. I didn’t build this to win the lottery; I built it to prove a point about mathematical reality and the absolute brutality of variance.
People constantly bet on ‘due’ numbers, assuming the system has a memory. I wanted to visually map the ‘Dead Zones’—those massive dark voids where a digit simply vanishes for 60+ draws—to show that the system doesn’t care about ‘fairness’ or human timelines.
To do this right, I built a modular ingestion engine on GCP. The California Lottery API is a structural nightmare (hardcoded timestamps and duplicate records) so I had to write custom ETL fetchers just to get clean data. The system is designed to scale; I can plug in a new state fetcher in an afternoon and run the raw JSON through my proprietary Markov and Poisson math engines in real-time.
I’m currently tracking the ‘Global Pulse’ of these games across multiple states to see where variance is clumping the hardest.
Happy to talk shop on the overarching architecture (FastAPI/React/Docker on Cloud Run) or the stochastic modeling used to generate these maps.
-J