
So I've been working on this visualizer for a while now.
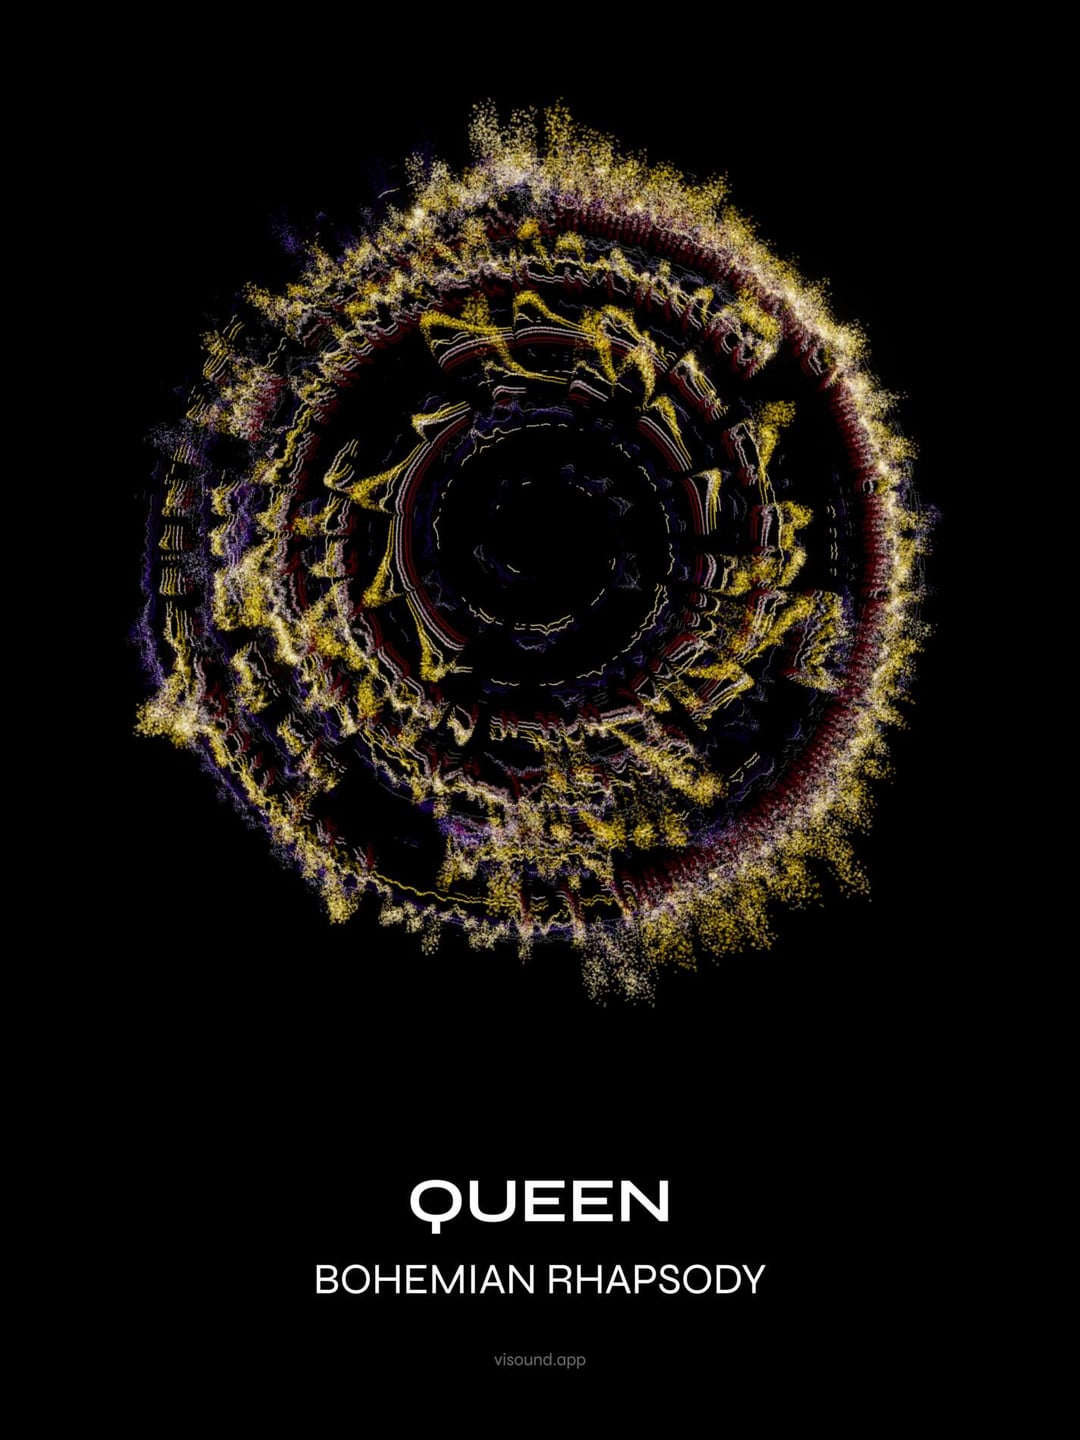
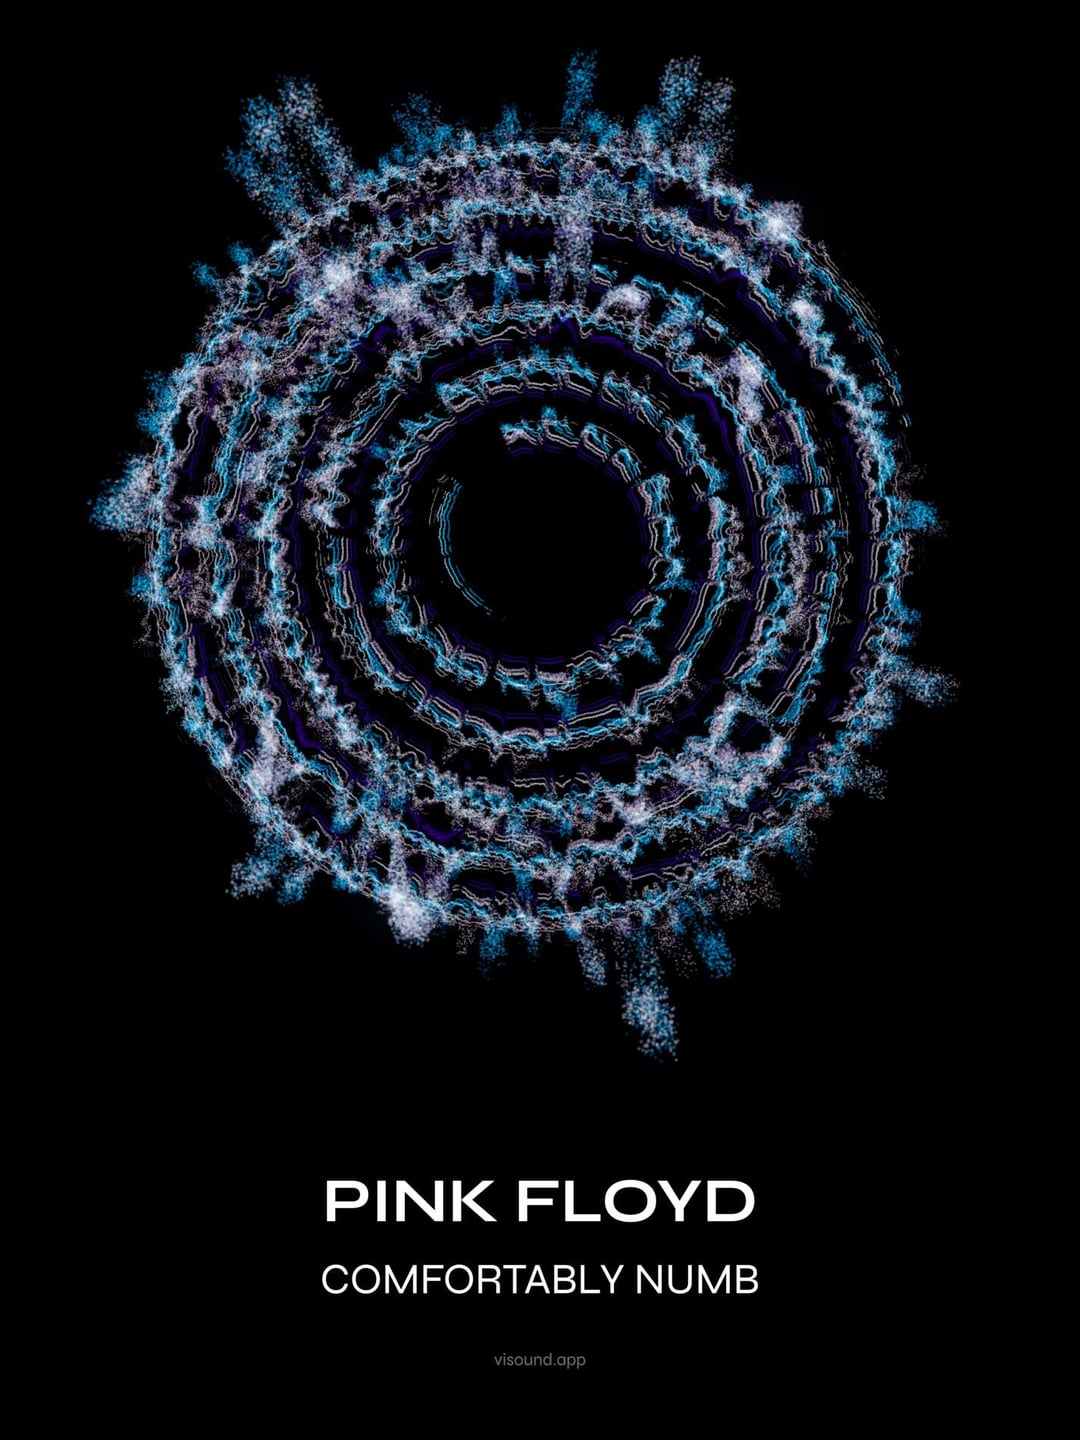
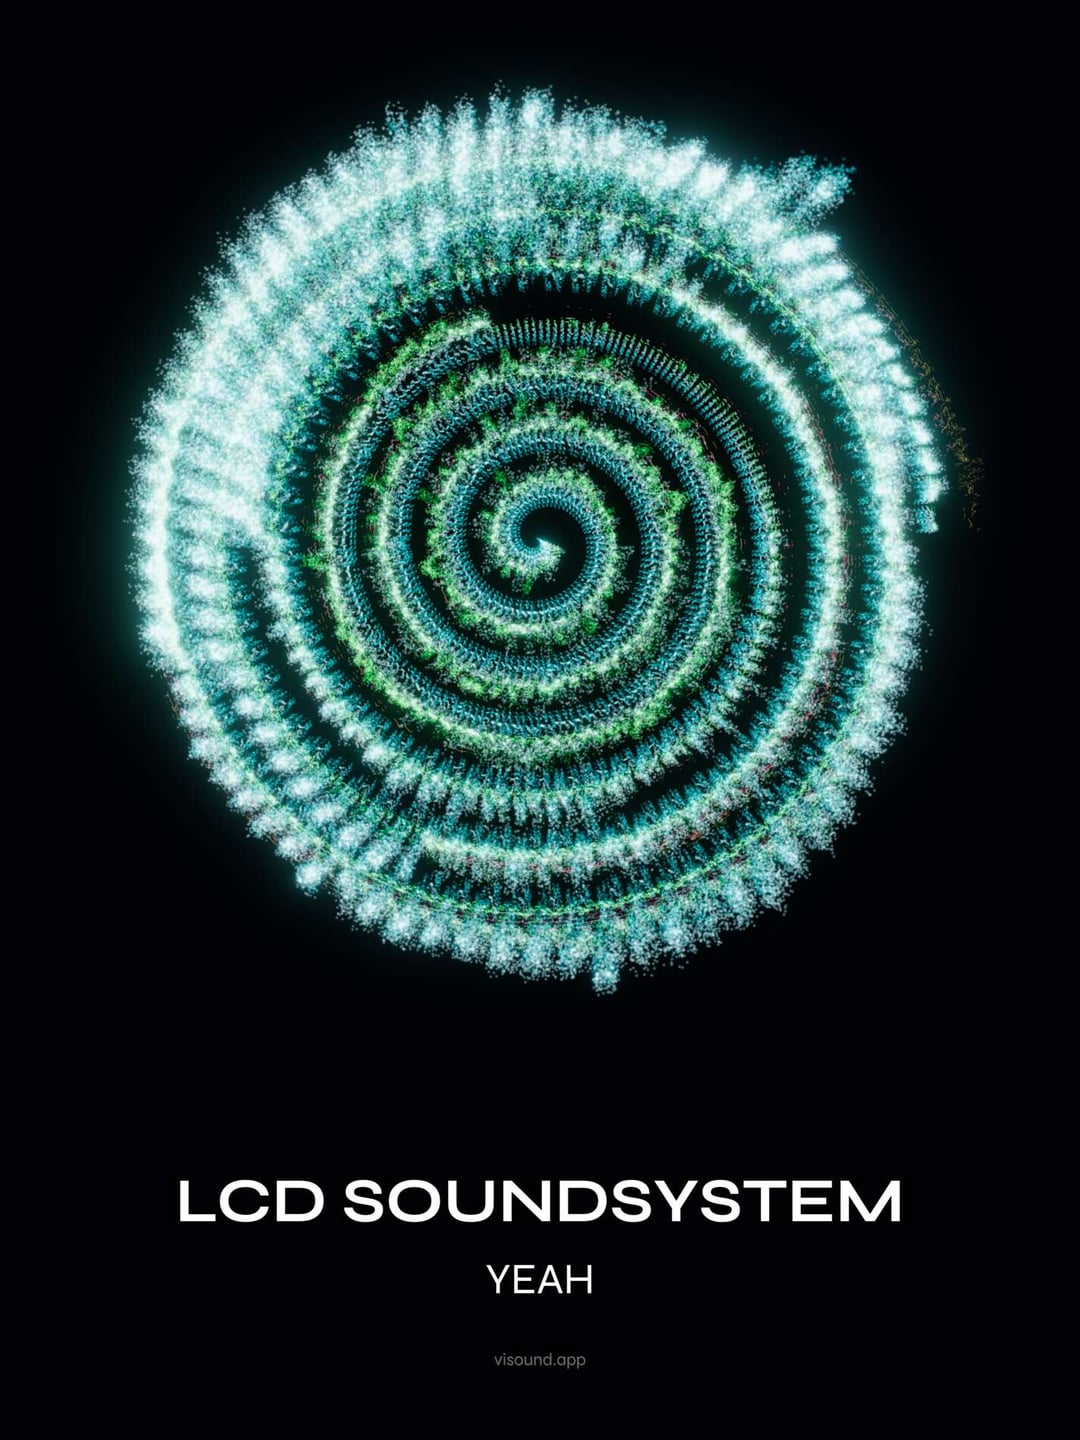
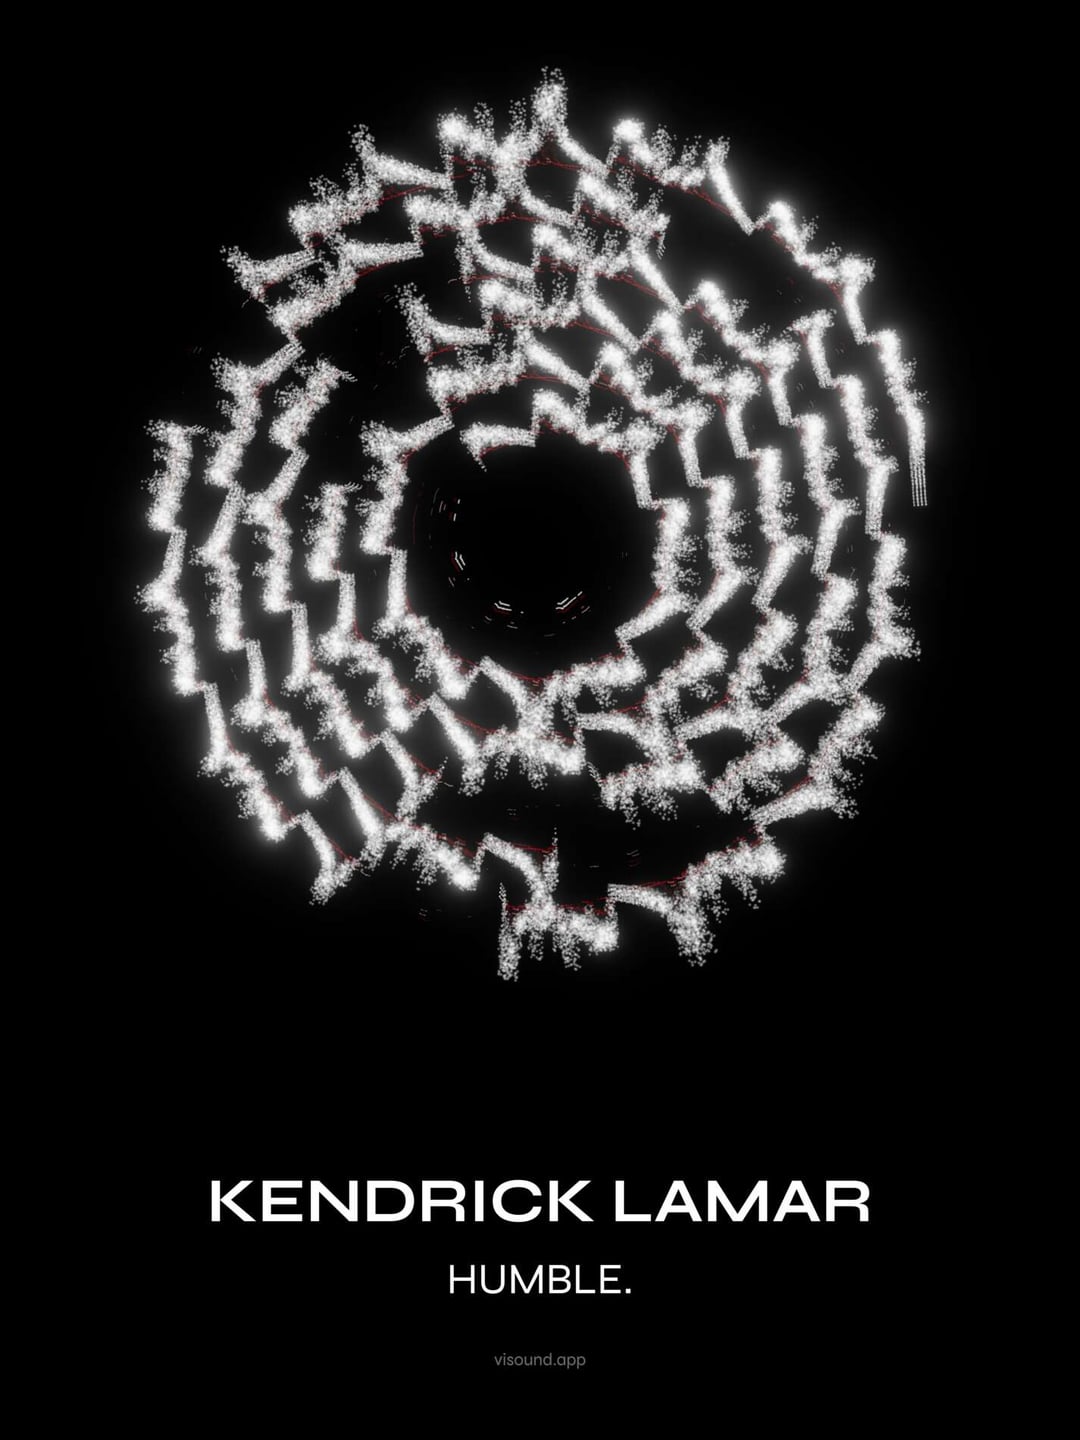
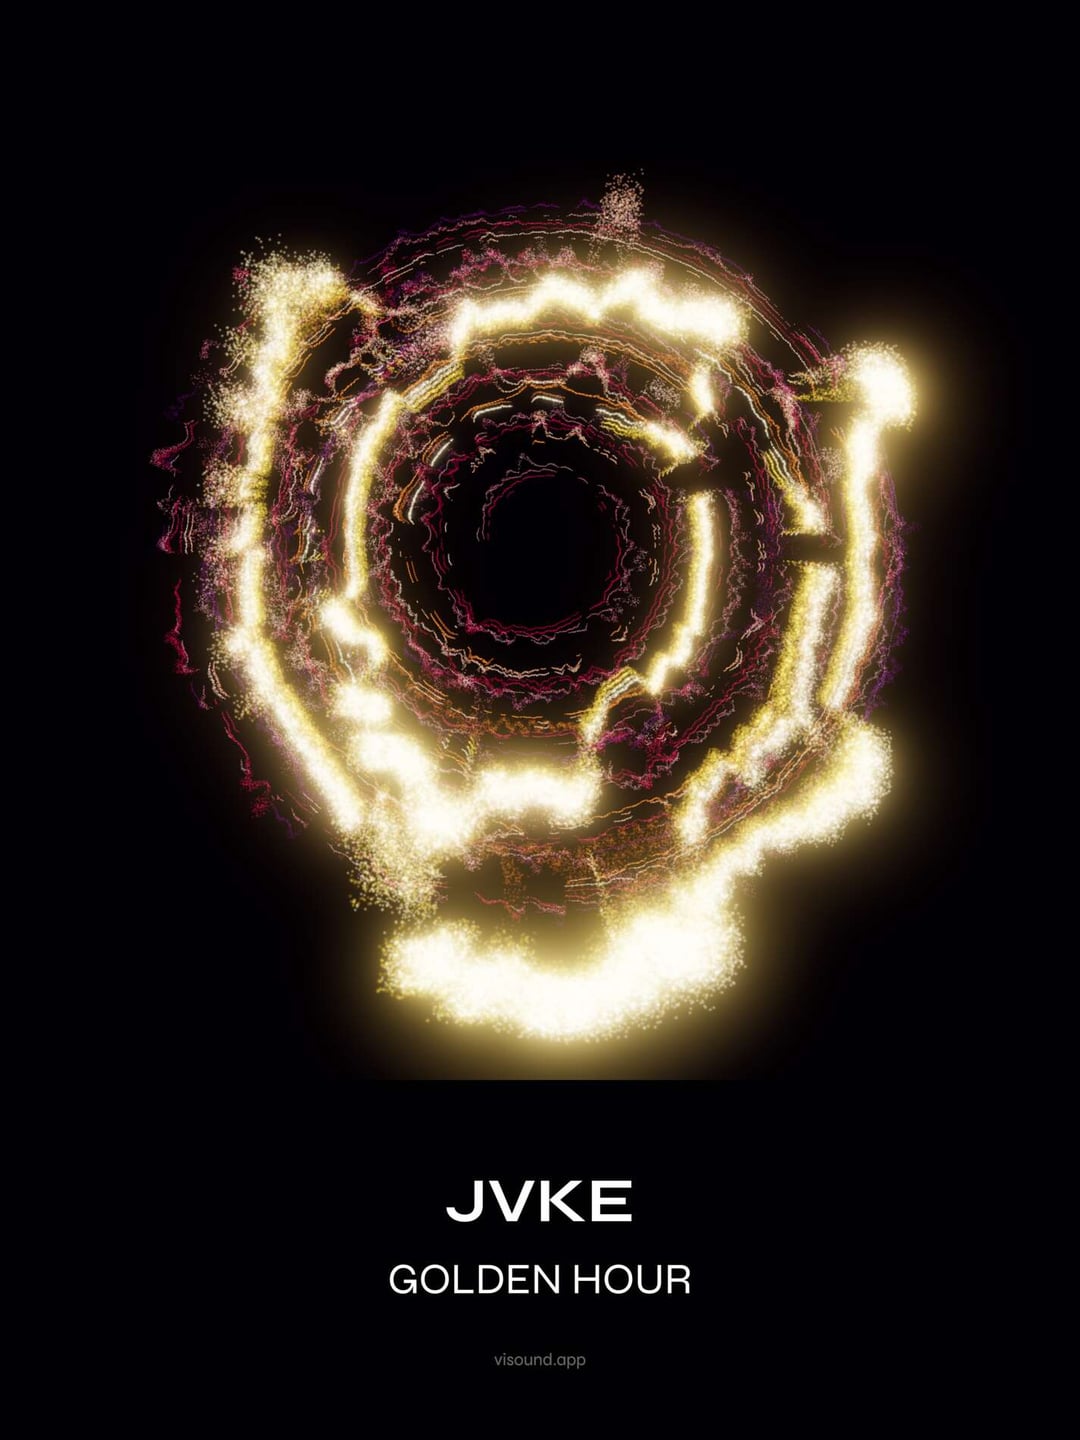
Basically it takes any song, breaks it into 20 frequency bands, and places particles on a spiral based on how loud each band is at any given moment starting from center to outside. More energy = more particles.
What's cool is you can actually see the structure of a song as a full image that you can print and frame. Digging the results so far.
by felipeumanzor
6 Comments
Cool bicycle cassette gears
Cool as a wallpaper or something nice 👍
Beautiful! Maybe a good idea to share with r/synesthesia
Reminds me of Windows Media Player from around 2002.
That’s not meant as shade, I loved watching those visualisations.
This is pretty awesome. Is it outside to in?
/j but why isn’t this a sankey
/uj Finally some ~~good fucking food~~ beautiful fucking data