
I work at Our World in Data and made this chart for a new section in our topic page on Globalization: https://ourworldindata.org/trade-and-globalization#trade-partnerships
by eortizospina
I work at Our World in Data and made this chart for a new section in our topic page on Globalization: https://ourworldindata.org/trade-and-globalization#trade-partnerships
by eortizospina
3 Comments
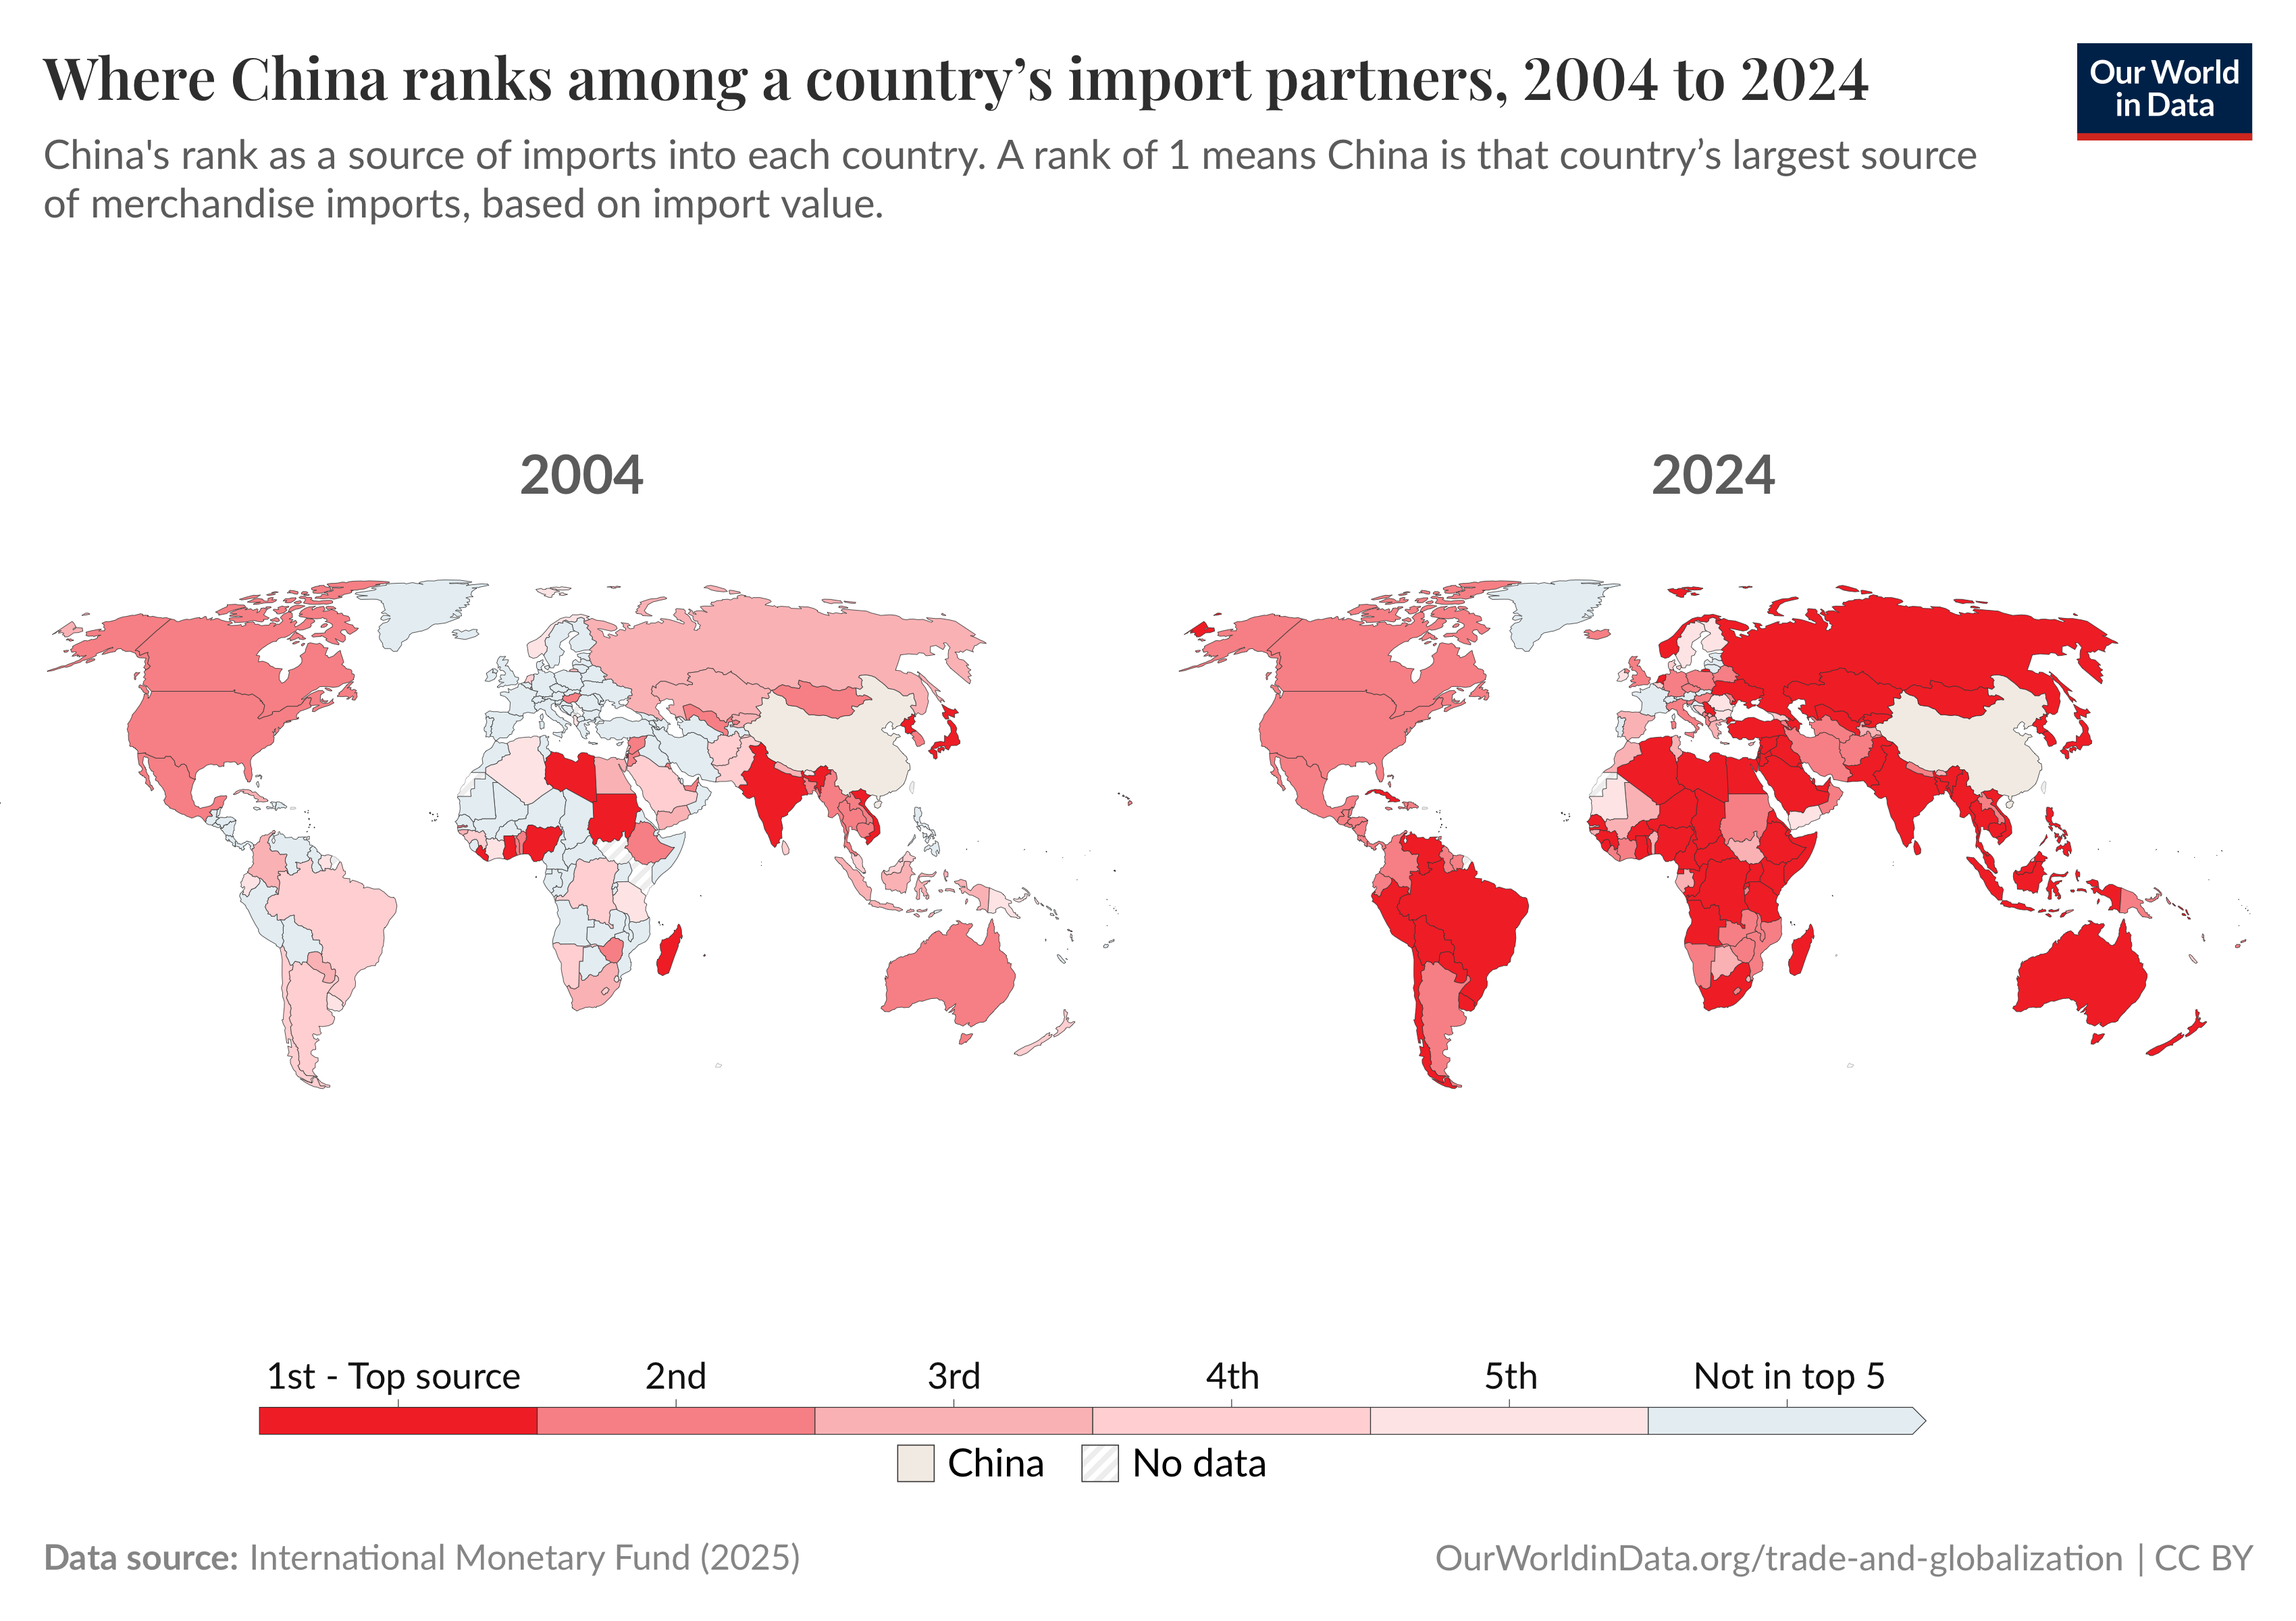
I work at Our World in Data and made this chart for a new section in our topic page on Globalization: [https://ourworldindata.org/trade-and-globalization#trade-partnerships](https://ourworldindata.org/trade-and-globalization#trade-partnerships)
You can find an interactive version of this chart here: [https://ourworldindata.org/grapher/chinas-rank-in-imports-of-goods](https://ourworldindata.org/grapher/chinas-rank-in-imports-of-goods)
I made this chart using data from IMF. Imports are valued on a CIF basis (Cost, Insurance, and Freight). This means the values include the cost of the goods, as well as the transport and insurance costs to deliver them to the importing country’s border.
In terms of tools, I used the OWID Grapher for a first version ([https://ourworldindata.org/faqs#what-software-do-you-use-for-your-visualizations-and-can-i-use-it](https://ourworldindata.org/faqs#what-software-do-you-use-for-your-visualizations-and-can-i-use-it)) and then I made adjustments in Figma.
isnt it because they undermined their own domestic consumer base so that most of the products produced would be sold abroad?
The choice of colors is incredible