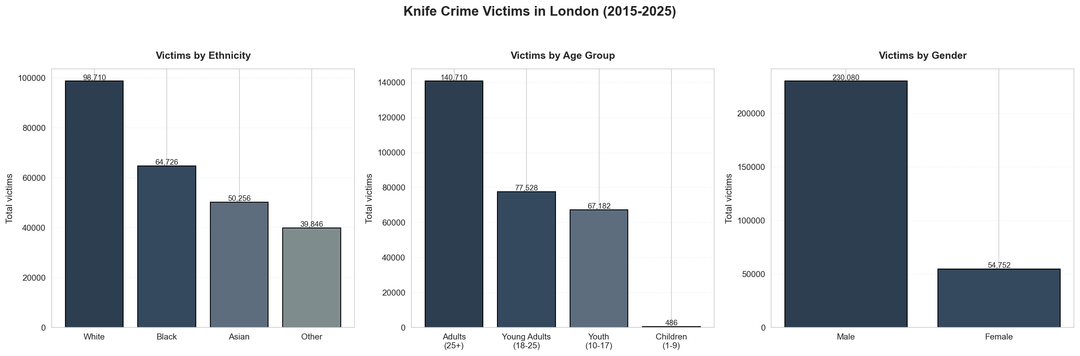
So according to that first image, middle chart… if we add up the totals of the bars, 140k, 60k and 80k, it means there have been 280k knife crime victims in London in a decade.
That averages at 76 victims a day.
That seems high. What constitutes a victim? Is being threatened by a knife wielding mugger a knife crime?
mr_pou on
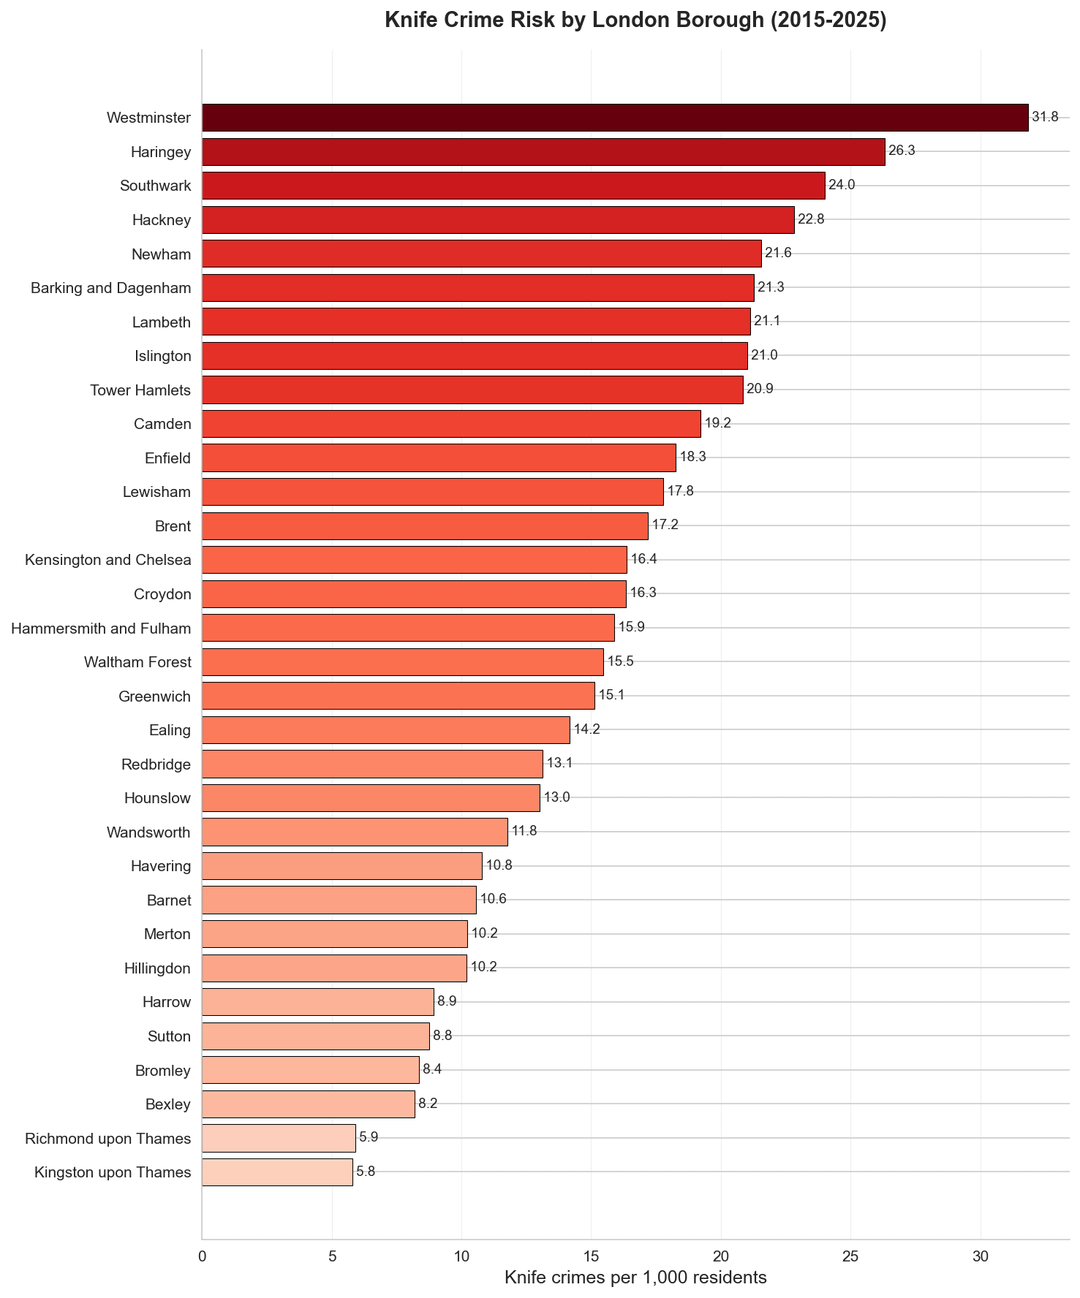
The ghetto that is *Westminster* 🤷🏻
stevied71 on
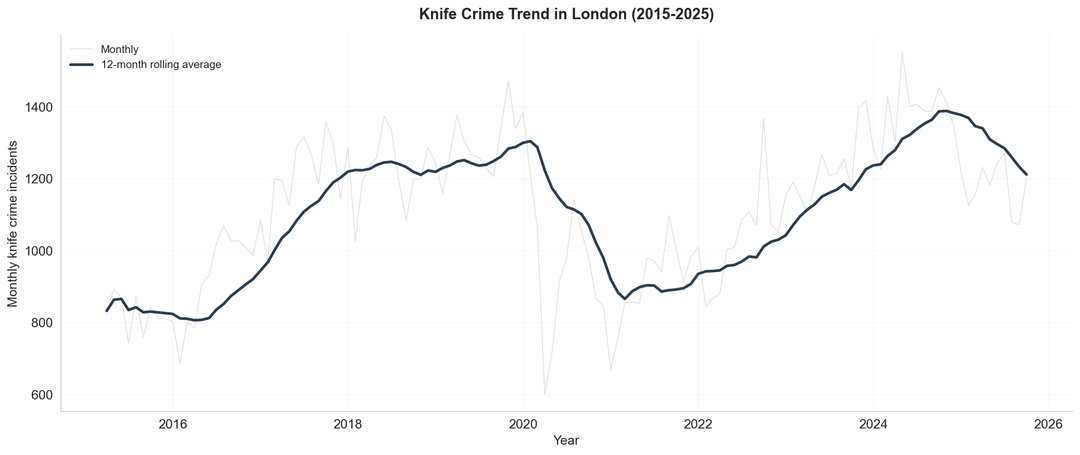
so trend over time is that, covid years excluded, it’s really the same as it ever was.
tanghan on
Wouldn’t statistics on the aggressors be more insightful than of the victims?
Usnoumed on
Can you take the data back 30 years?
badmancatcher on
Is Croydon so low because gun crime is more common? How is Hackney not top 3!? /s (kind of)
DrKurgan on
First pic would be better if showed the victims relative to the total population.
Also if 1-9 is very low and +25 is low compared to its population size. It’s possible most stabbings are 15-20 and 10-15 and 20-25 are low as well, but we don’t know with that chart.
LordByronsCup on
How wooooooo!
Knife crimes of London.🎶
Soluchyte on
You can really see how big the difference between south west london is compared to basically everywhere else.
Pigsnot1 on
Can you account for population in the London graph? Considering London has over a million more people today than it had in 2015, the graph isn’t giving a great representation of the true incidence rate

15 Comments
well looks like the next wave is coming to an end.. so that’s nice I guess. I didn’t know they fluctuate like ice ages.
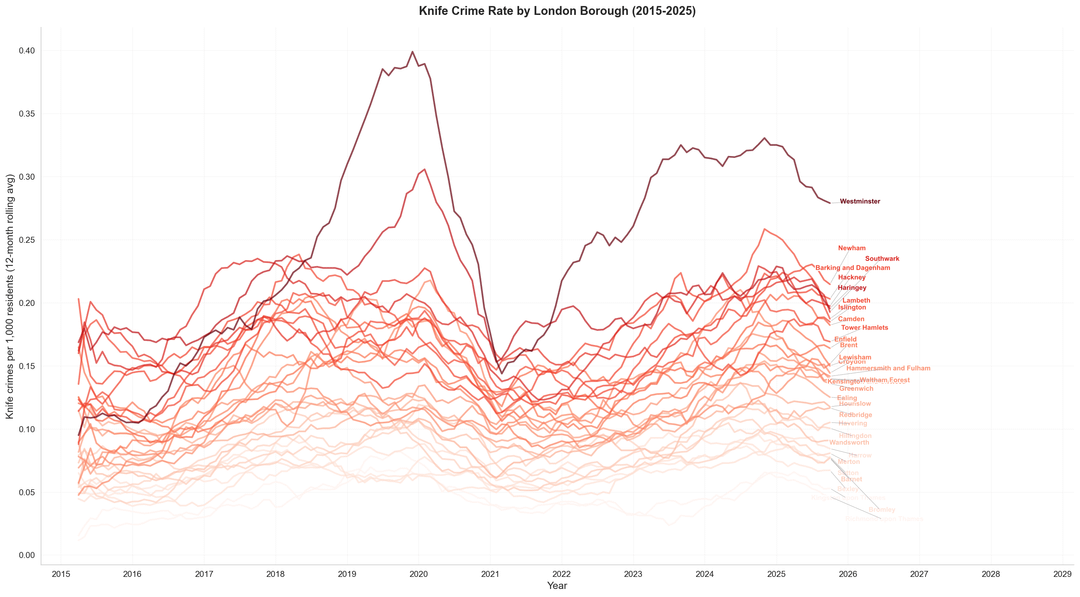
Used Python / Matplotlib for plotting, sources are london met police data from [https://data.london.gov.uk/dataset/mps-monthly-crime-dashboard-data-e5n6w](https://data.london.gov.uk/dataset/mps-monthly-crime-dashboard-data-e5n6w) and ONS population to get per 1000 values [https://data.london.gov.uk/dataset/office-for-national-statistics-ons-population-estimates-borough–vd615/](https://data.london.gov.uk/dataset/office-for-national-statistics-ons-population-estimates-borough–vd615/)
So on average about 72,000 per year.
I’m no mathematician, but that sounds like a lot.
So according to that first image, middle chart… if we add up the totals of the bars, 140k, 60k and 80k, it means there have been 280k knife crime victims in London in a decade.
That averages at 76 victims a day.
That seems high. What constitutes a victim? Is being threatened by a knife wielding mugger a knife crime?
The ghetto that is *Westminster* 🤷🏻
so trend over time is that, covid years excluded, it’s really the same as it ever was.
Wouldn’t statistics on the aggressors be more insightful than of the victims?
Can you take the data back 30 years?
Is Croydon so low because gun crime is more common? How is Hackney not top 3!? /s (kind of)
First pic would be better if showed the victims relative to the total population.
Also if 1-9 is very low and +25 is low compared to its population size. It’s possible most stabbings are 15-20 and 10-15 and 20-25 are low as well, but we don’t know with that chart.
How wooooooo!
Knife crimes of London.🎶
You can really see how big the difference between south west london is compared to basically everywhere else.
Can you account for population in the London graph? Considering London has over a million more people today than it had in 2015, the graph isn’t giving a great representation of the true incidence rate
How many deaths did these attacks cause?
The most interesting slide is not included