
We've visualised Melbourne-specific dating data from multiple sources to get a clearer picture of how modern relationships are forming — and what’s worrying people most in 2025.
The infographic includes:
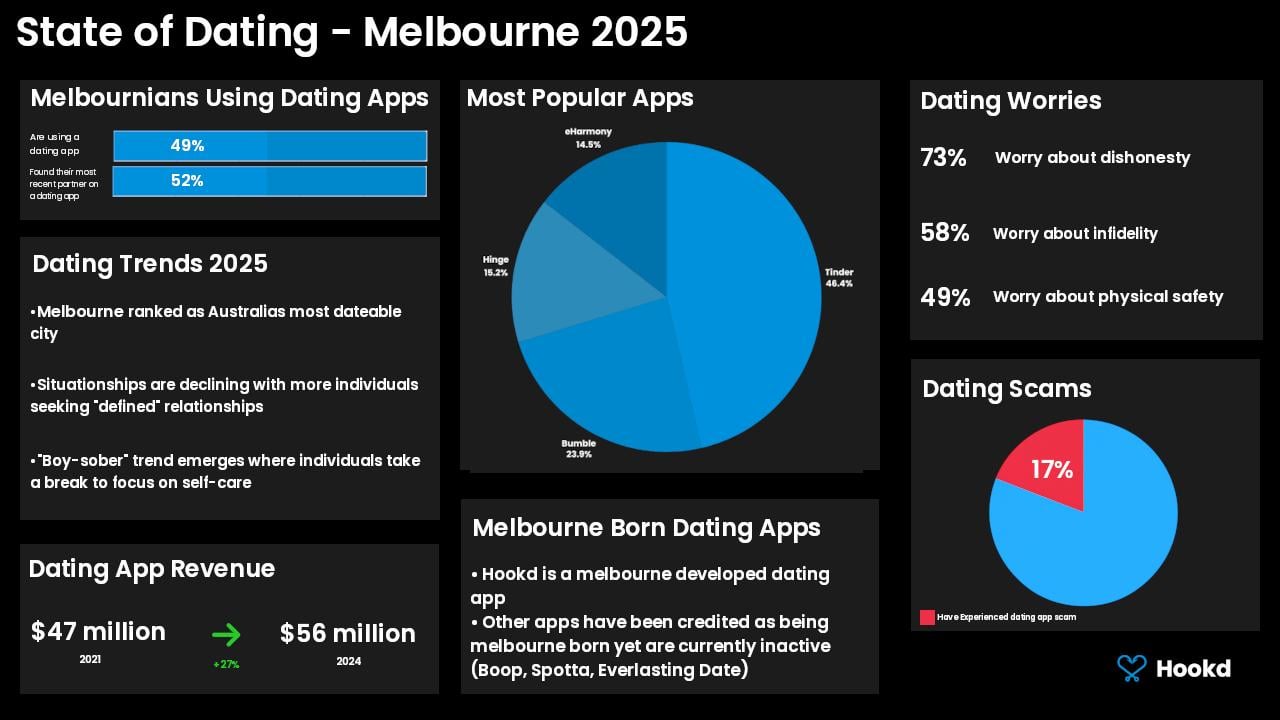
- Percentage of Melburnians using dating apps — and how many actually meet partners through them.
- Most popular dating platforms in the city (Tinder still dominating, but Bumble/Hinge catching up).
- Key emotional concerns from singles: dishonesty, infidelity, and physical safety.
- Rising reports of dating scams.
- Cultural trends like the “boy-sober” movement and a noticeable shift away from situationships.
- Local app revenue growth (+27% in just 3 years).
- Plus, a quick nod to dating apps that were developed in Melbourne.
Let us know — does this match your experience in the city? Are the concerns overblown or right on point?
📊 Data Sources:
- Australian Bureau of Statistics, Household and Family Relationships
- ABC News, “Is it just me or is dating harder than ever?” (2024)
- Tinder Year in Swipe Report 2023
- Statista: “Most used dating apps in Australia” (2023)
- eSafety Commission: Online Dating Safety Report (2023)
- University of Melbourne, Social Trends Report 2024
- IBISWorld: Online Dating Services in Australia
- Reddit & Whirlpool community discussions
🖼️ Image is OC (Original Content). Designed with Melbourne in mind. All stats are cited, visualised for clarity, and color-coded for accessibility.
by hookd-networks
3 Comments
colour coded for accessibility? I am pretty sure I am not colour blind, and those blues are almost impossible to distinguish from one another
So many abstentions! I didn’t even realize.
What does “dateable city” even mean? I’ve had way less luck since moving here than I did in Brisbane. Same profile and everything, much larger population and in a better area here. Waaaay fewer matches.