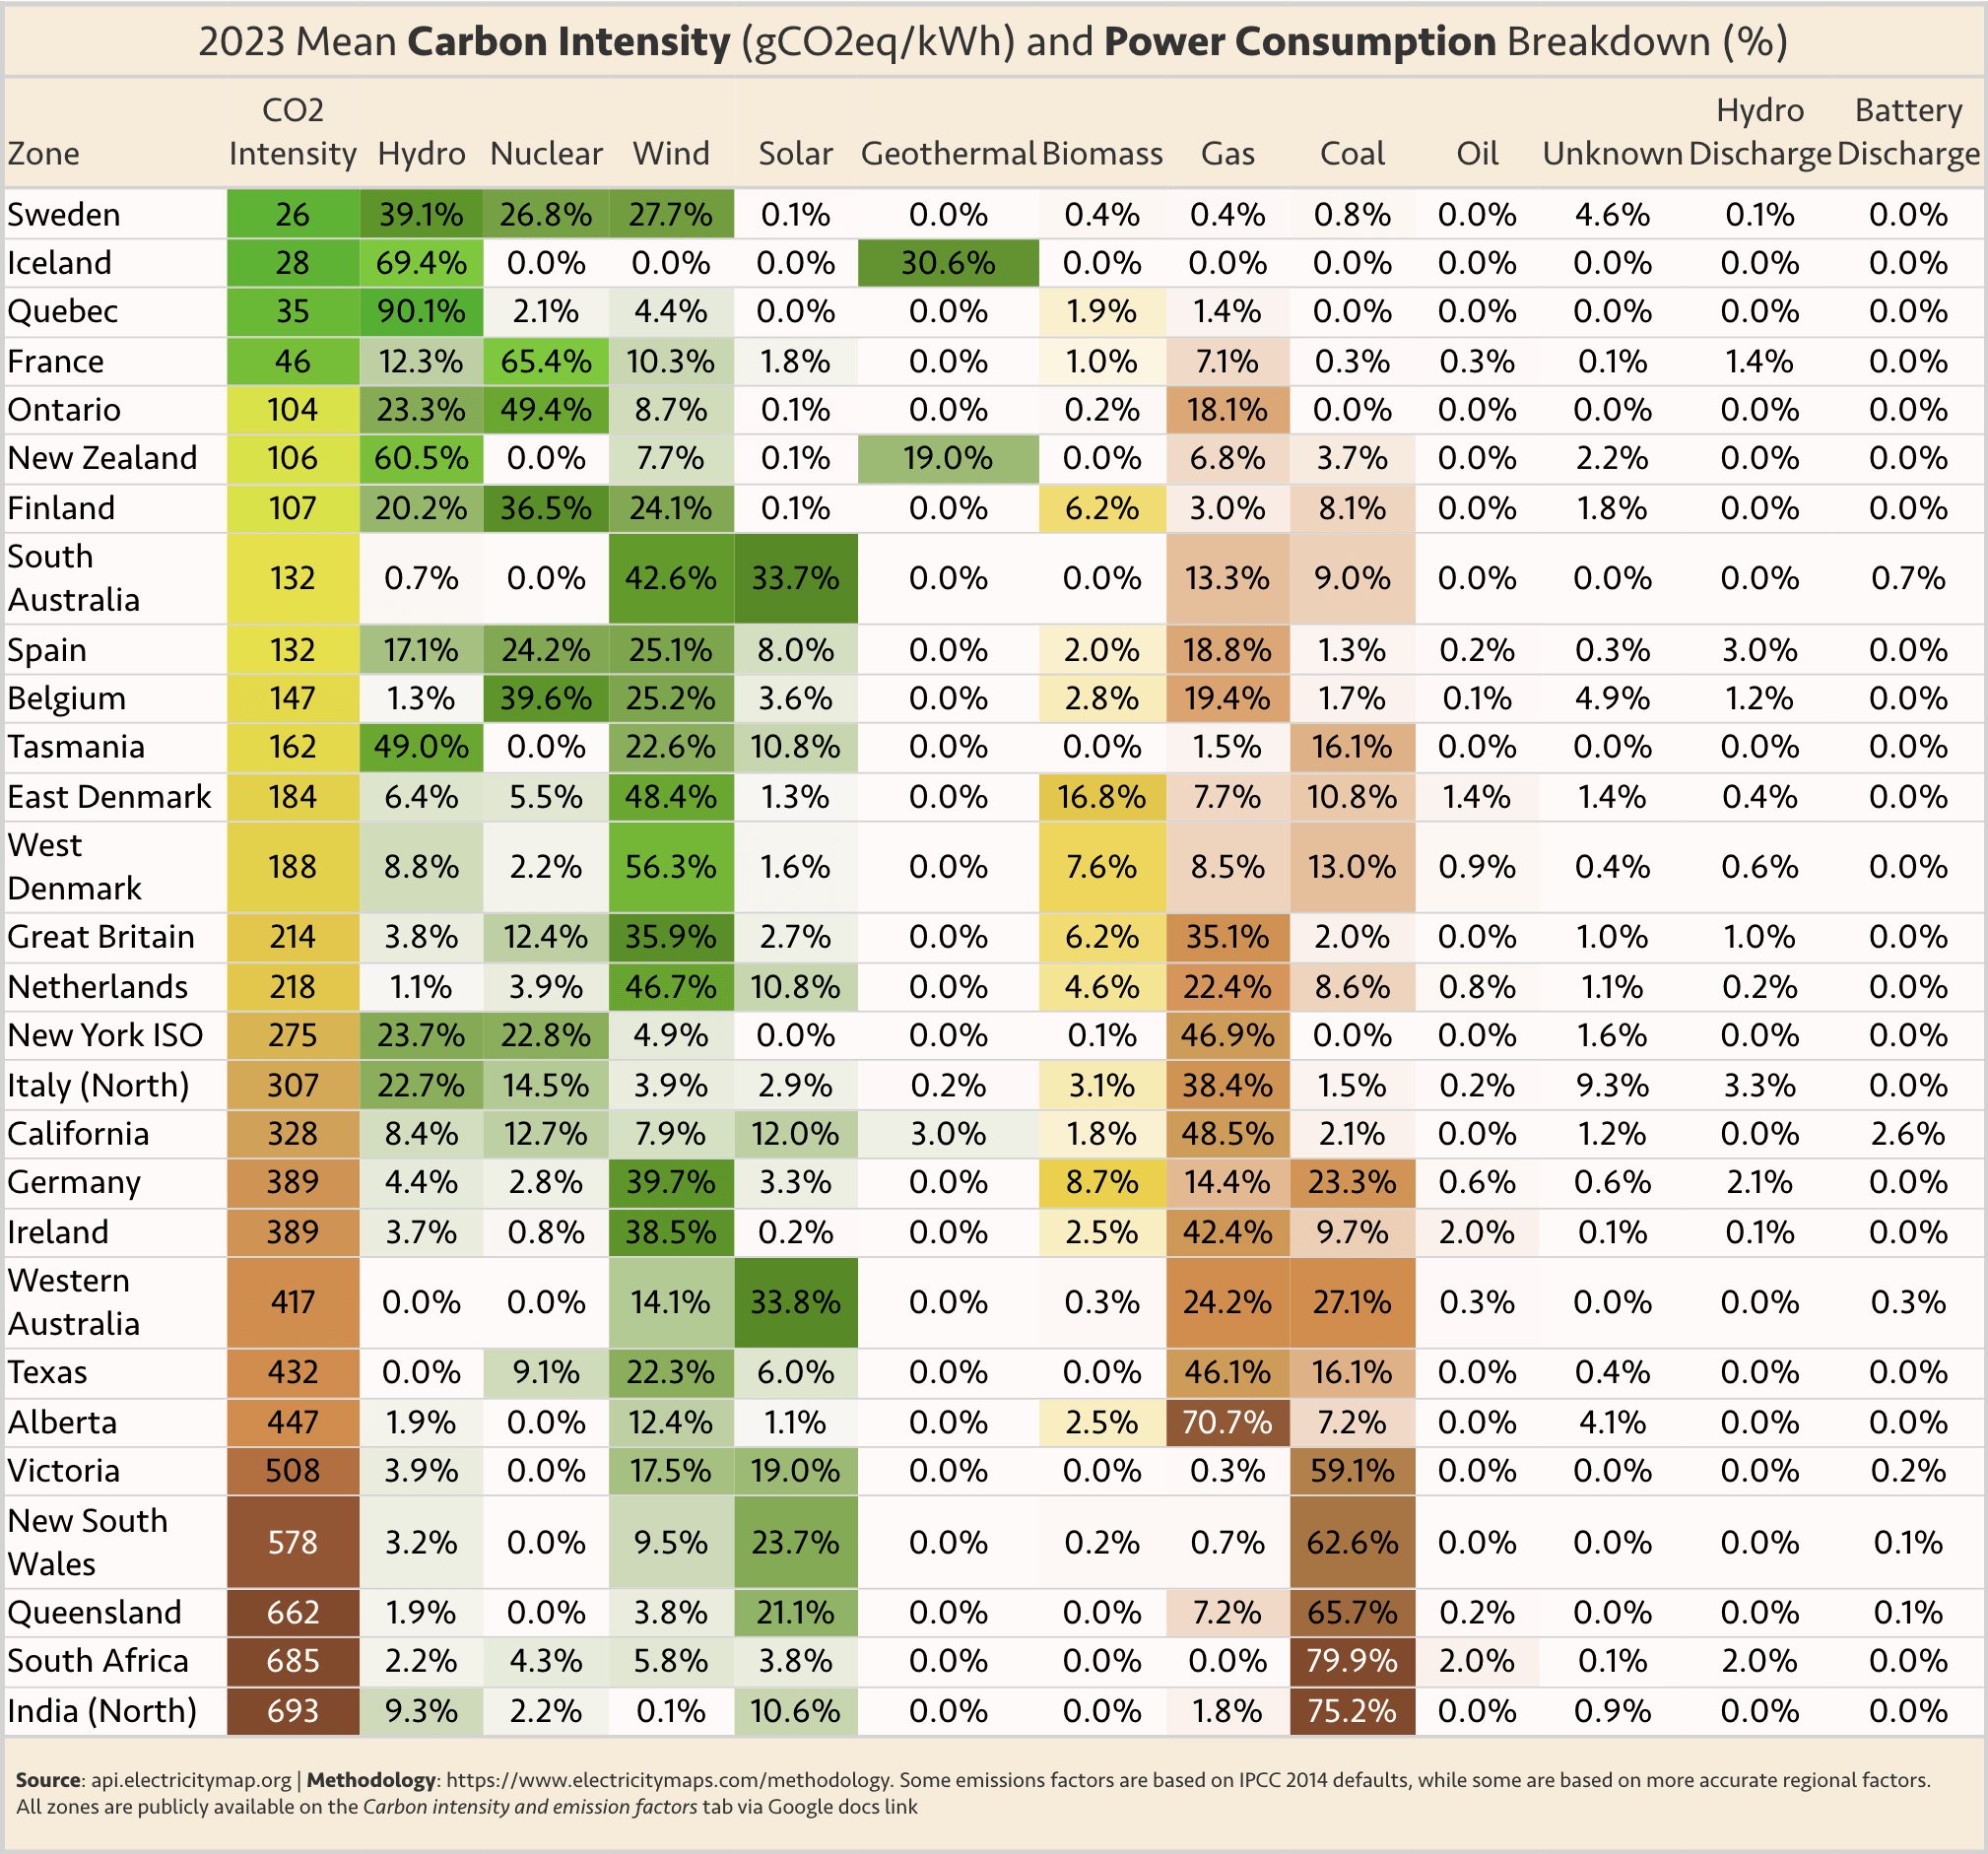
**Source**: [api.electricitymap.org](http://api.electricitymap.org), **Methodology**: https://www.electricitymaps.com/methodology. Some emissions factors are based on IPCC 2014 defaults, while some are based on more accurate regional factors. All zones are publicly available on the *Carbon intensity and emission factors* tab via Google docs link
twohedwlf on
NZ clearly needs some nuclear to replace the gas and coal.
Bonoisapox on
I don’t see how nuclear power has a high green rating, nuclear waste is the most toxic by product out there, it can’t be disposed of just buried and hidden, stays dangerous for 1000’s of years.

3 Comments
Carbon Intensity of Electricity Consumption. An HTML data display table made with python and the great_table python package (https://posit-dev.github.io/great-tables/examples/).
By Grant Chalmers.
**Article & documentation**: Carbon Intensity of Electricity Consumption, [https://chalg.quarto.pub/carbon-intensity-of-electricity-consumption/](https://chalg.quarto.pub/carbon-intensity-of-electricity-consumption/)
**Data and code**: [https://gist.github.com/chalg/93ca29e202ab86e7d4caad44726372e4/d17c1b4ba608ae1c3df6ac7fc377065ae5708ba7](https://gist.github.com/chalg/93ca29e202ab86e7d4caad44726372e4/d17c1b4ba608ae1c3df6ac7fc377065ae5708ba7)
**Source**: [api.electricitymap.org](http://api.electricitymap.org), **Methodology**: https://www.electricitymaps.com/methodology. Some emissions factors are based on IPCC 2014 defaults, while some are based on more accurate regional factors. All zones are publicly available on the *Carbon intensity and emission factors* tab via Google docs link
NZ clearly needs some nuclear to replace the gas and coal.
I don’t see how nuclear power has a high green rating, nuclear waste is the most toxic by product out there, it can’t be disposed of just buried and hidden, stays dangerous for 1000’s of years.