GDP from https://www.bea.gov/data/gdp/gdp-state
State-level population figures from https://fred.stlouisfed.org/release/tables?eid=259194&rid=118
Calculated in Excel, mapped using Datawrapper.
by StatisticUrban

GDP from https://www.bea.gov/data/gdp/gdp-state
State-level population figures from https://fred.stlouisfed.org/release/tables?eid=259194&rid=118
Calculated in Excel, mapped using Datawrapper.
by StatisticUrban
5 Comments
GDP from [https://www.bea.gov/data/gdp/gdp-state](https://www.bea.gov/data/gdp/gdp-state)
State-level population figures from [https://fred.stlouisfed.org/release/tables?eid=259194&rid=118](https://fred.stlouisfed.org/release/tables?eid=259194&rid=118)
Calculated in Excel, mapped using Datawrapper.
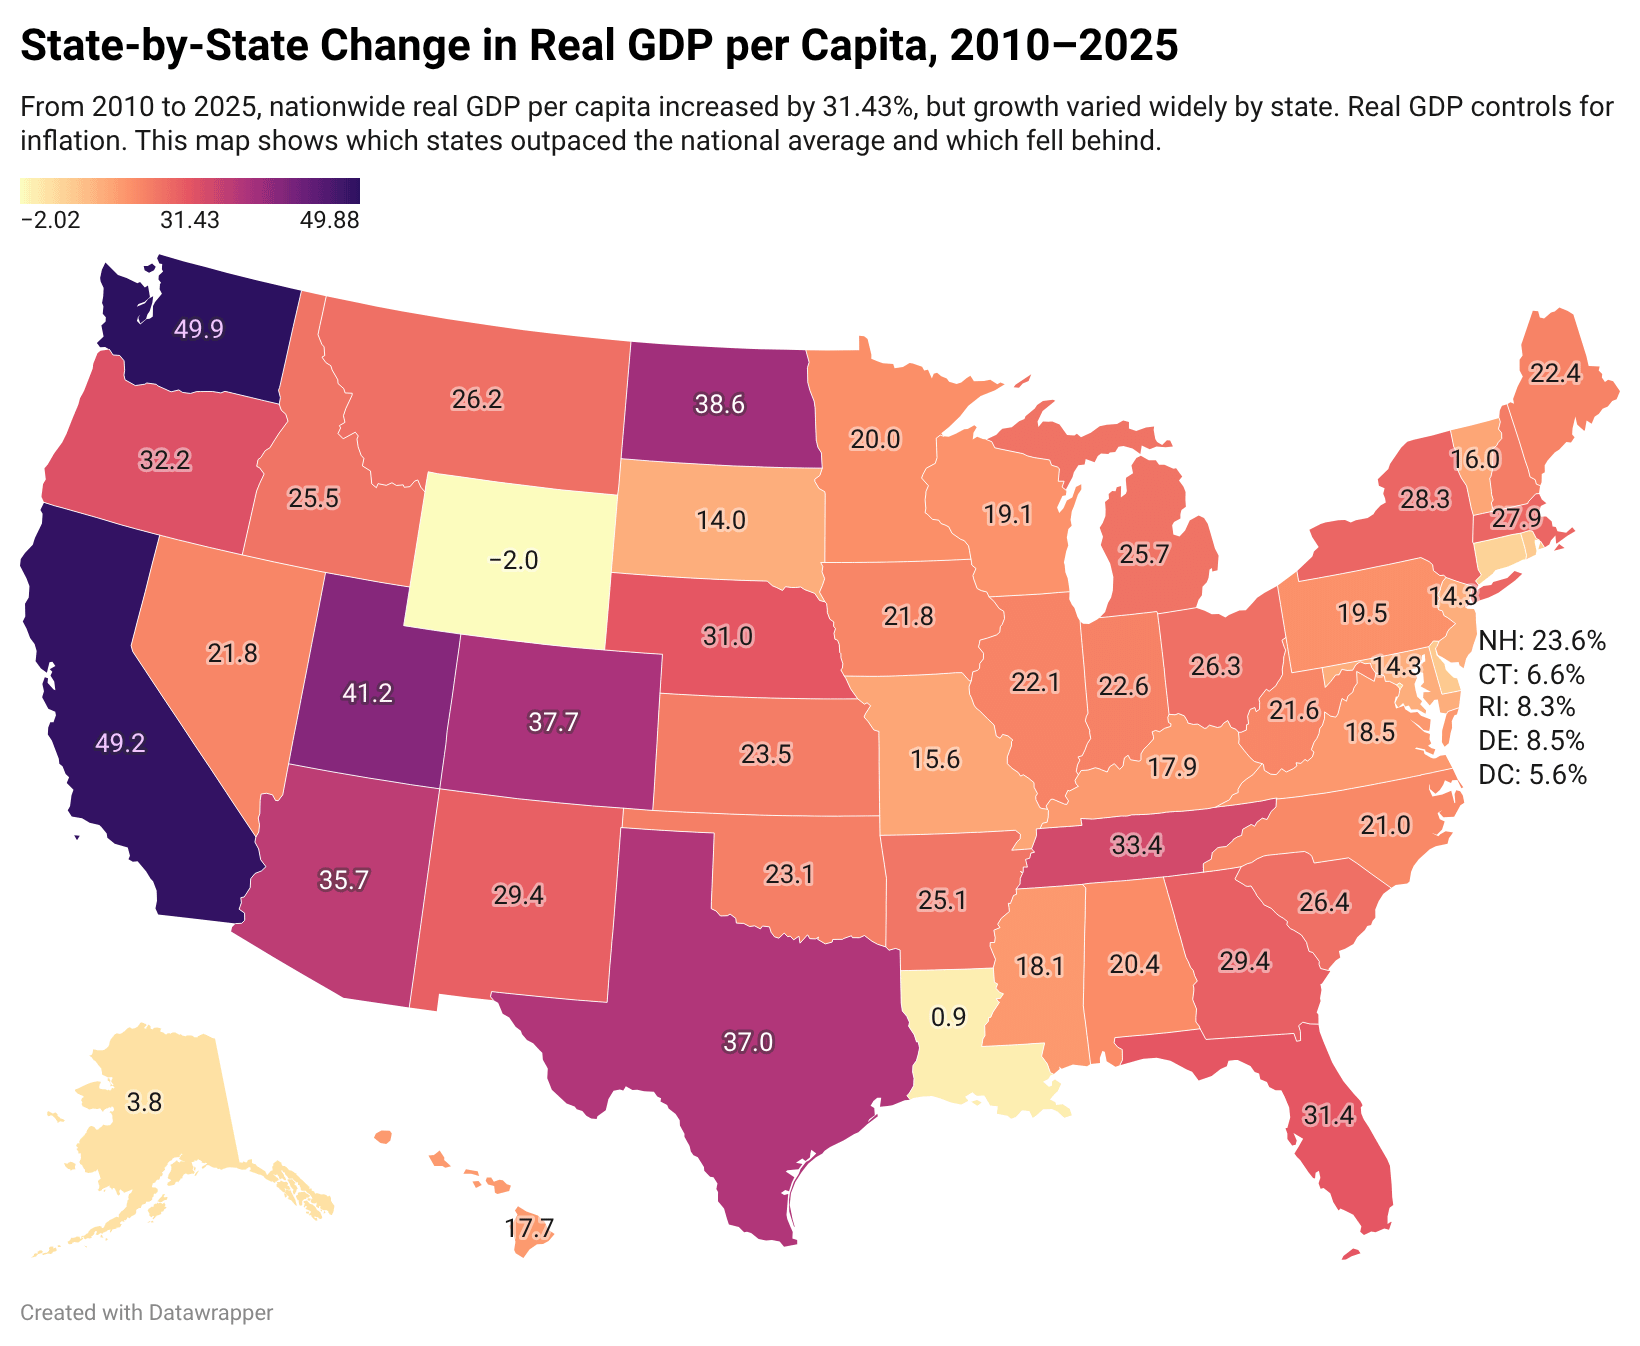
As you can see, the tech boom powered WA and CA to first and second. The graph controls for inflation and population change.
What’s the story with Louisiana and Wyoming? They are doing significantly worse than any of the surrounding states. Since this is data from 2010 to 2025 I’m thinking that hurricane Katrina (2005) can’t be a very significant factor for Louisiana, but maybe I’m wrong about that.
Nice is there a way to compare to a post WW2 1945 to 1960 boom years would be interesting comparisons.
What’s with California, I’ve been told that the state has been going down for a decade. That it has turned into hell on earth! /s
North Dakota is best Dakota