
Data Sources:
- AfricaNews
- Asia News Network
- EUObserver Economy
- MercoPress South America
- Currents API (used to collect and build the international news dataset related to the Iran–US conflict between Feb 2026 – May 2026)
Tools Used:
- Python
- GeoPandas
- Matplotlib
- NumPy
- Shapely
- Natural Earth world boundaries dataset
Methodology:
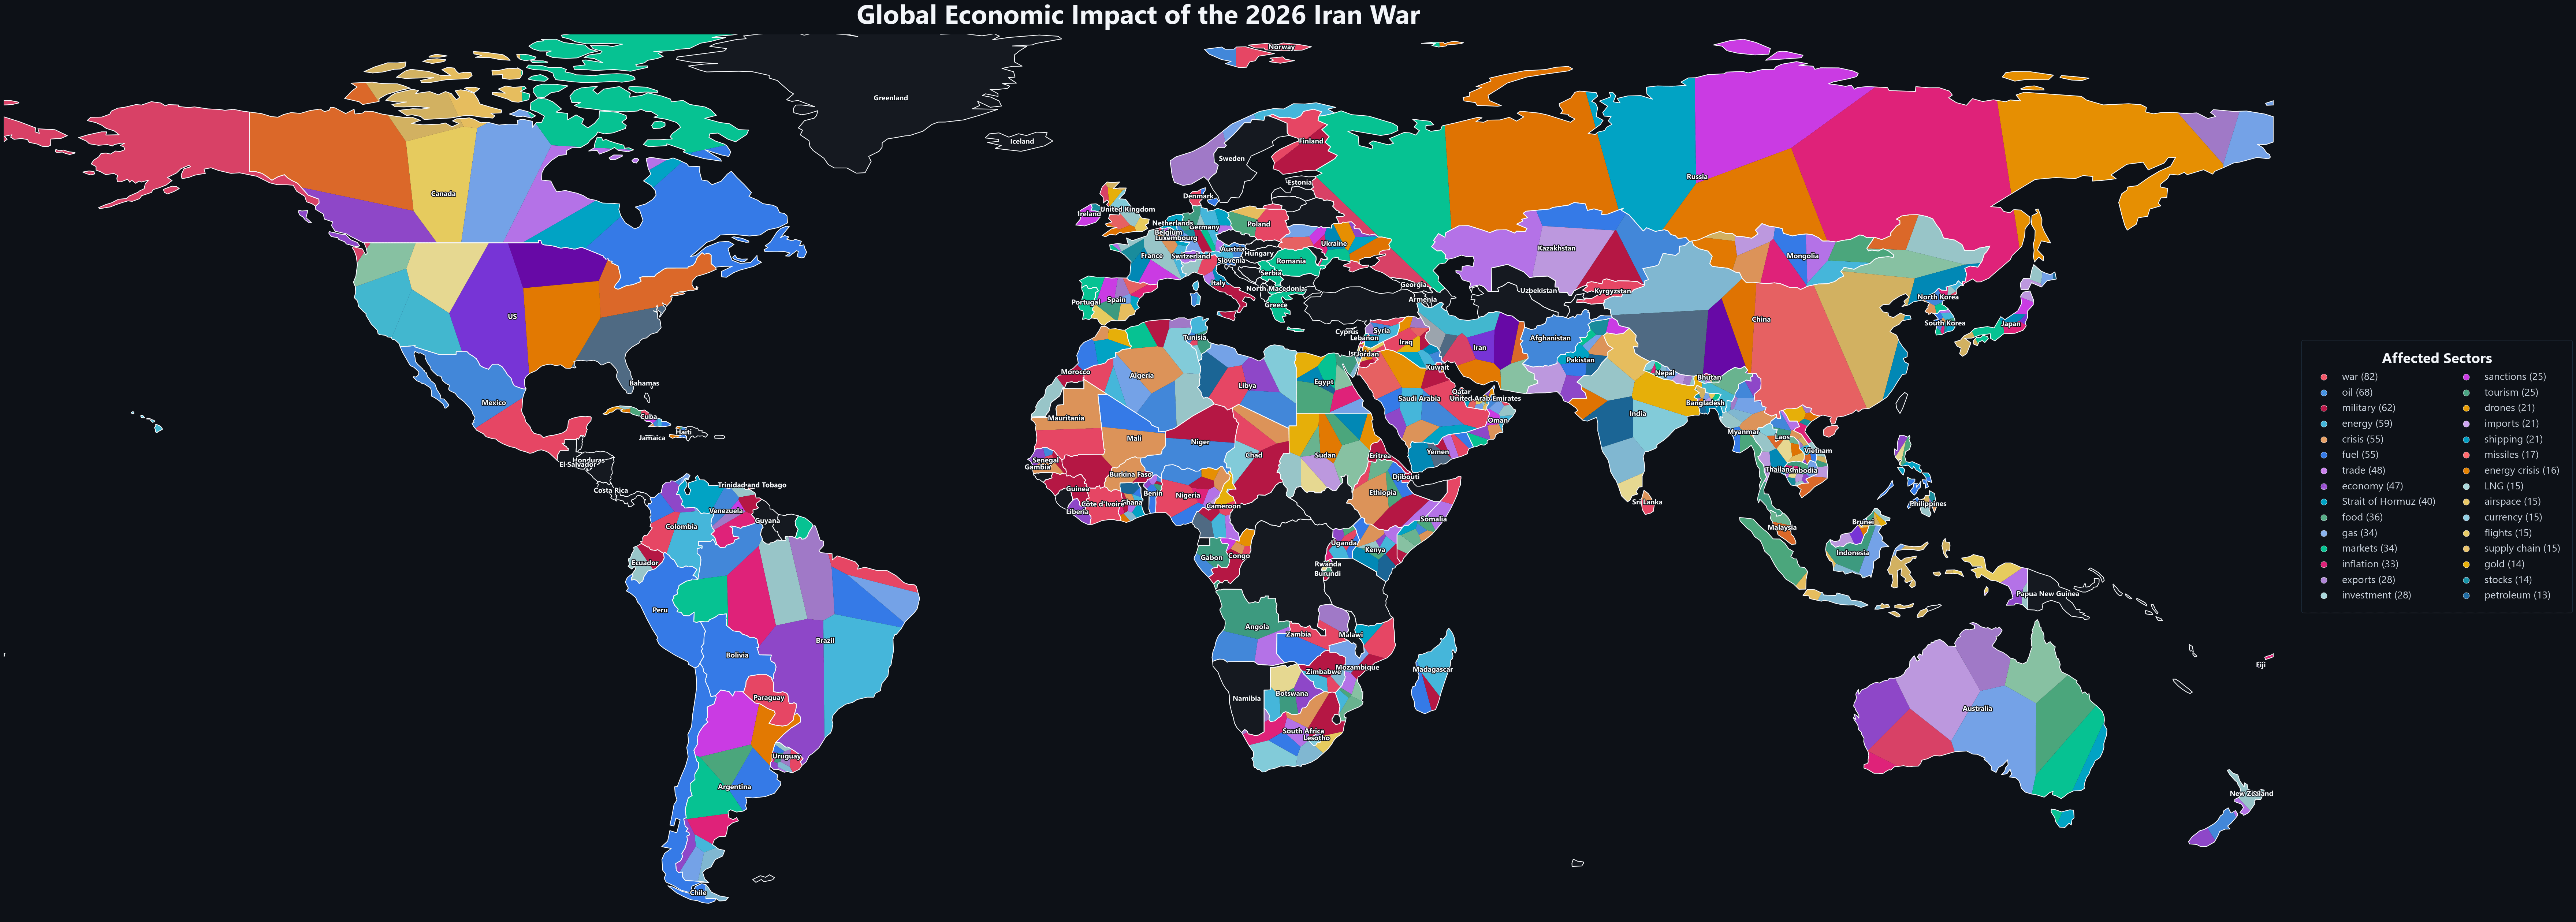
Countries and economic/geopolitical sectors were extracted from international news coverage related to the 2026 Iran–US conflict. Each country was linked with affected sectors such as oil, sanctions, shipping, inflation, LNG, trade, military activity, and energy markets.
The map uses Voronoi-based internal country segmentation to visualize multiple simultaneous economic impacts within individual countries rather than assigning only one category per nation.
by Cyclo_Studios
1 Comment
The Voronoi segmentation within each country is a smart call — it lets you show multiple simultaneous impact types pernation instead of forcing every country into a single category. Energy, trade, and inflation exposure rarely follow the same borders.