
Inspired by a comment on my other post from u/Prestigious_Risk7610
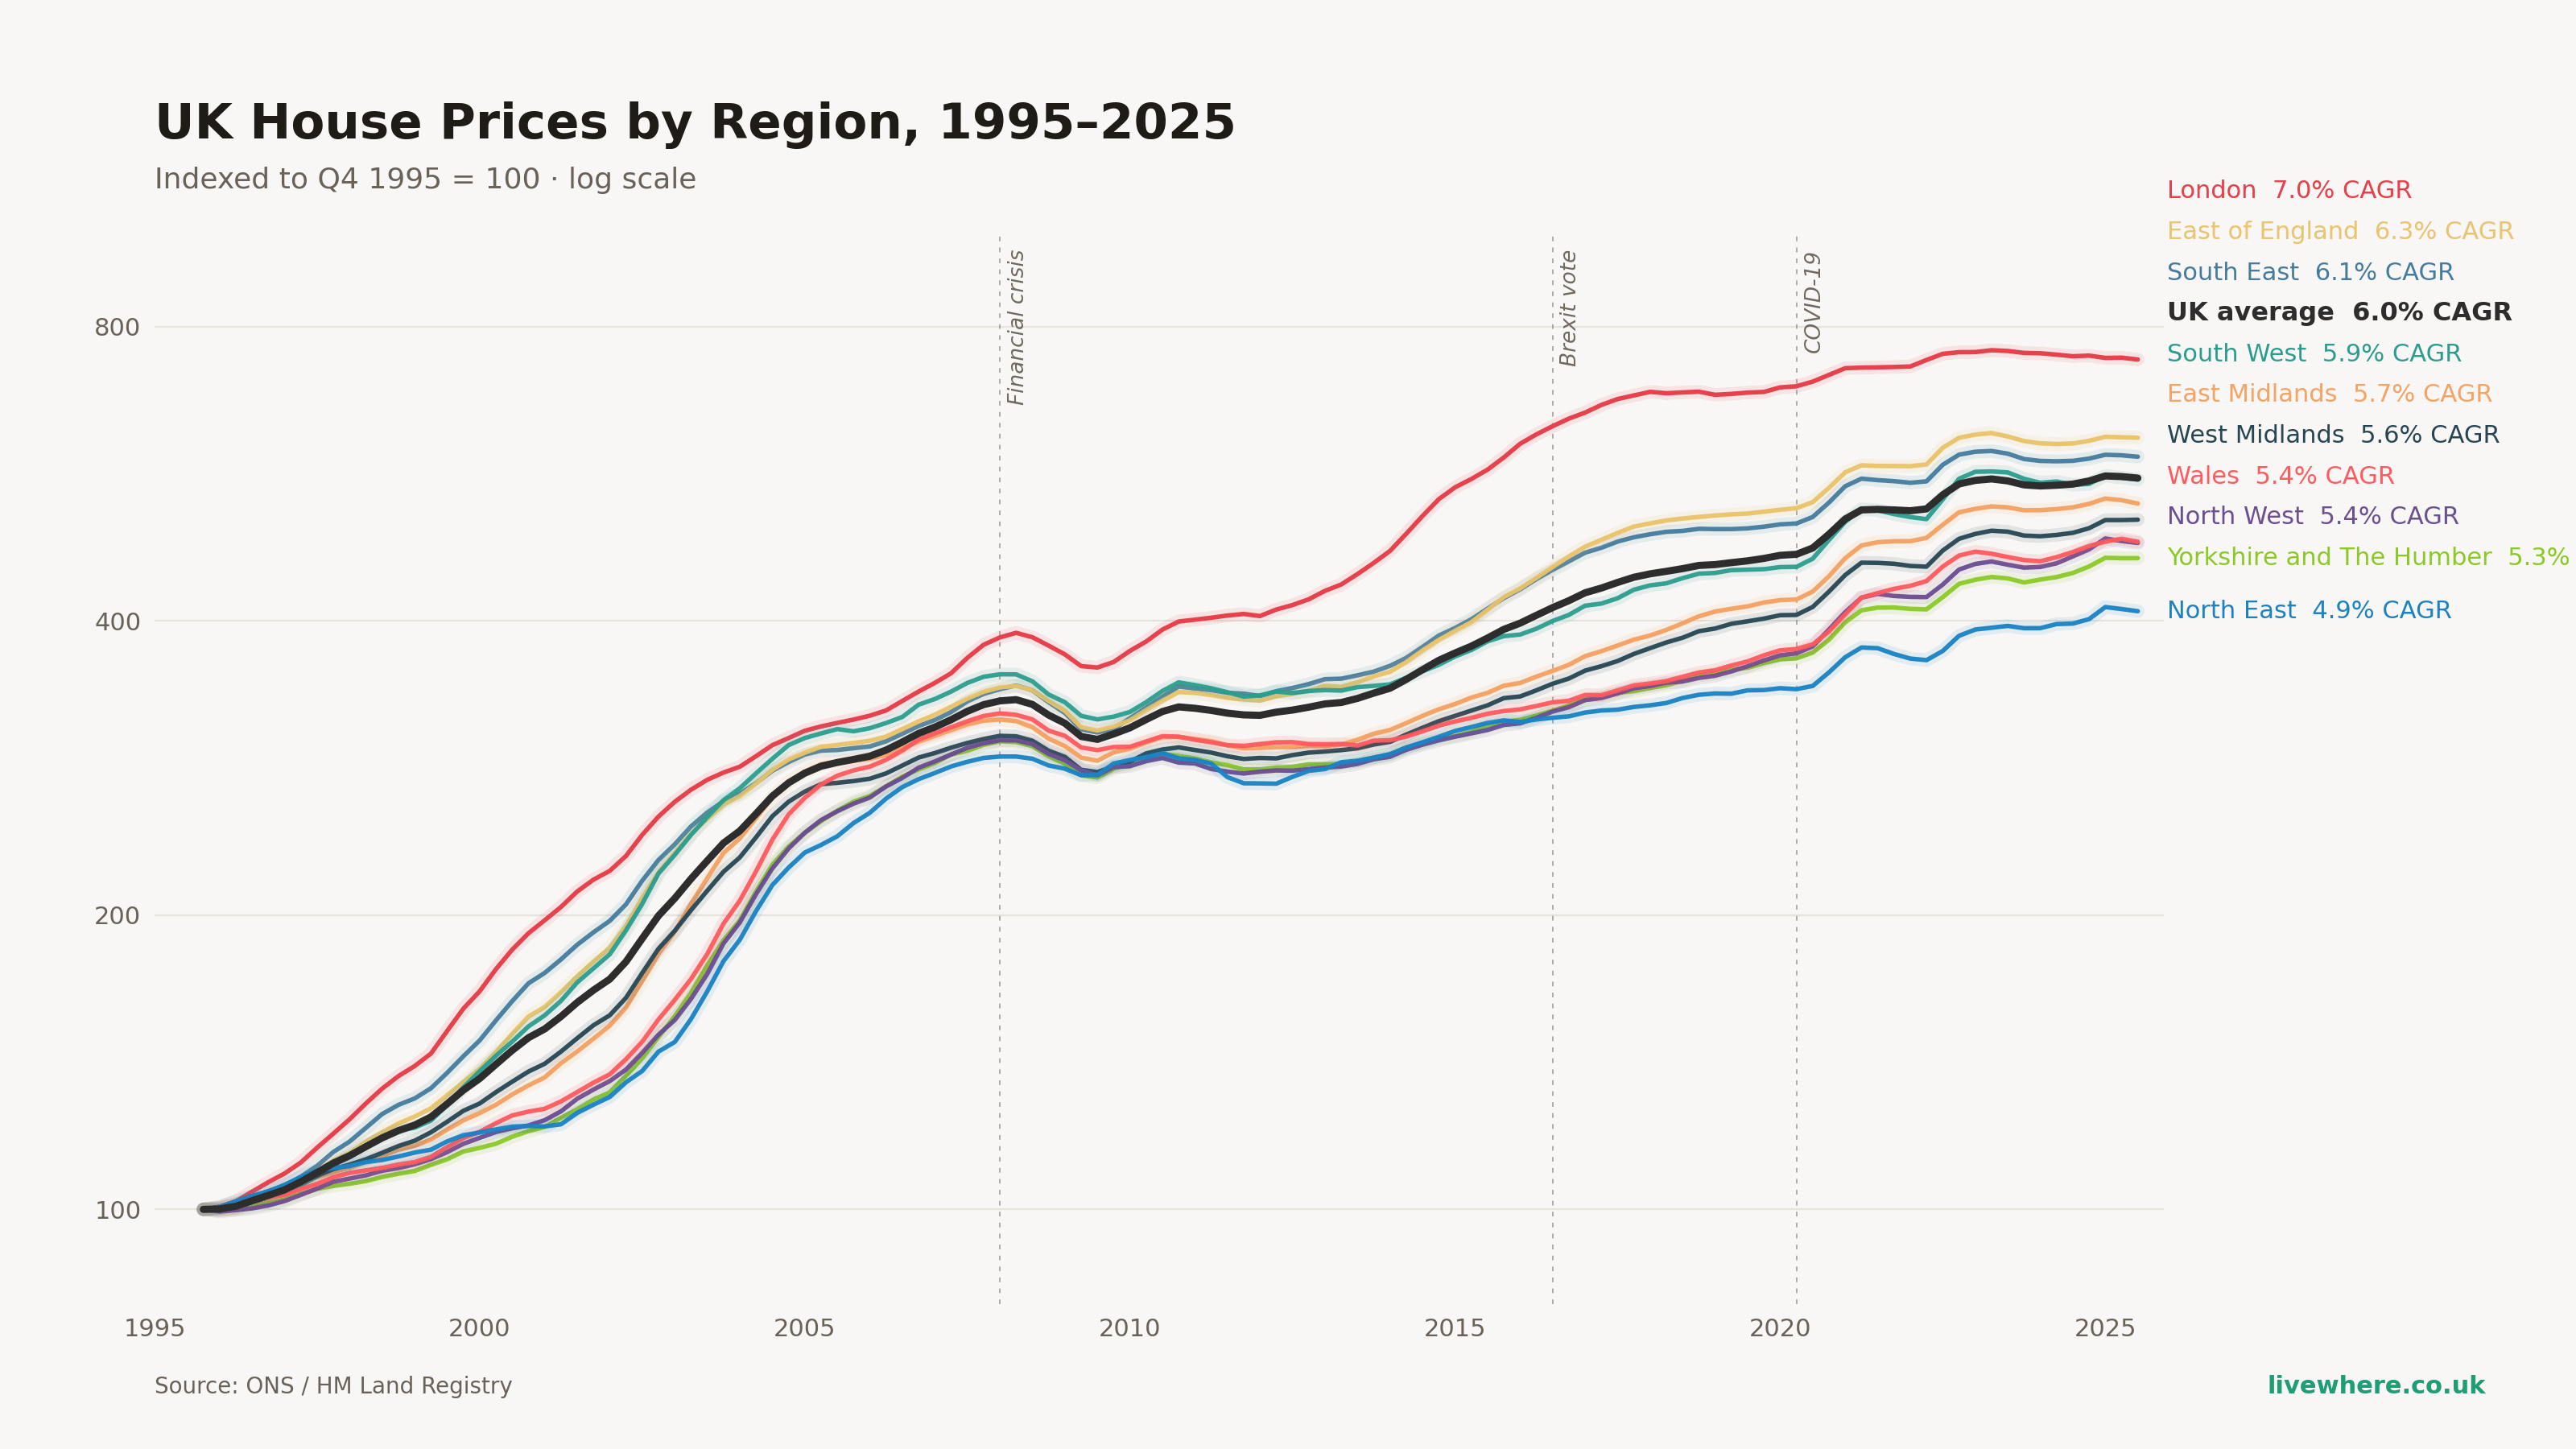
Each line shows the average of all local authorities in that region, indexed so Q4 1995 = 100. Log scale so equal vertical distances represent equal percentage changes.
Grouped by region rather than individual cities because with 319 local authorities the chart would be unreadable otherwise, regional averages show the broad divergence more clearly.
London has grown at 7.0% CAGR over the period, the North East at 4.9%. That 2.1 percentage point gap compounded over 30 years.
Covers England and Wales only – Scotland and Northern Ireland aren't available in this dataset at local authority level.
Source: ONS / HM Land Registry (HPSSA dataset)
Tool: Python / matplotlib
More Data & Comparisons: https://livewhere.co.uk/
by BanksforBitcoin