
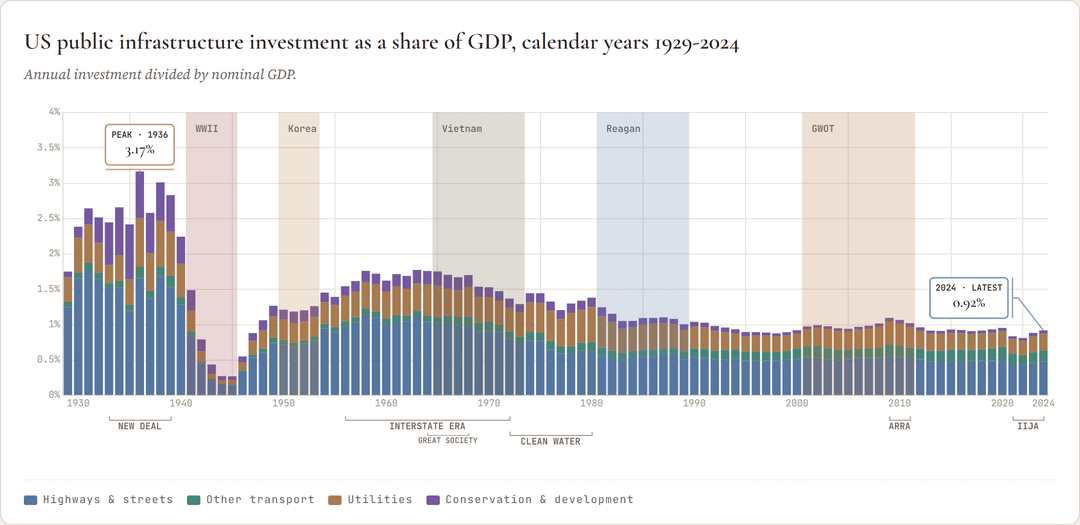
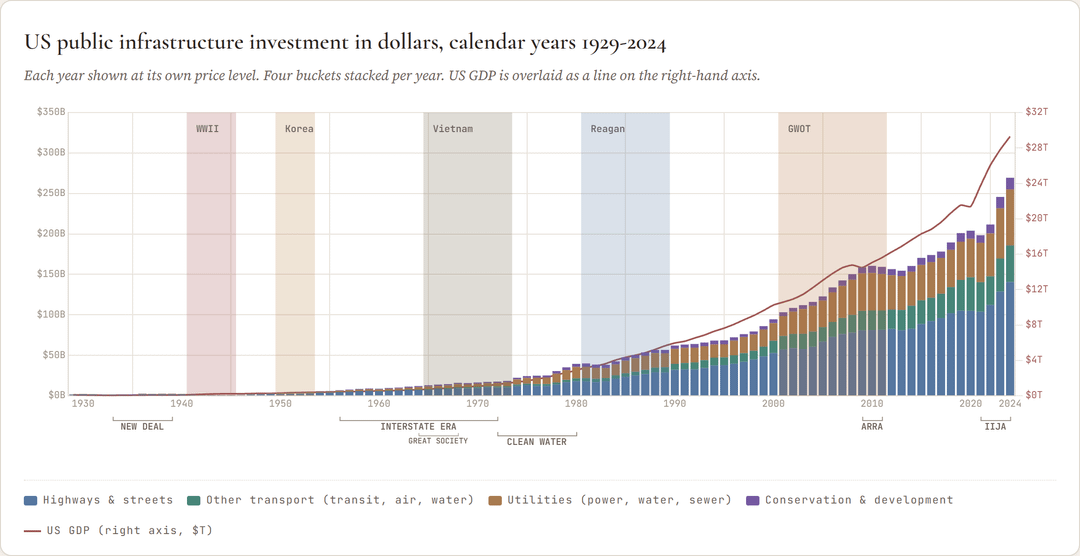
Government gross investment in structures, 1929 to 2024.
Data Sources – Table data
BEA NIPA Table 5.9.5 Gross Government Fixed Investment by Type. Accessed via the BEA Data API. The table publishes Federal Nondefense and State-and-Local structures separately, broken out by structure type. (apps.bea.gov)
The four segments on the chart sum the relevant federal and state-and-local lines into all-government totals. Federal Defense structures (military bases and so on) are excluded entirely as these would come under a "military spending" budget
Segment mapping: Highways & streets = lines 25 + 40; Other transport (transit, air, water) = lines 23 + 38; Utilities (power, water, sewer) = lines 24 + 39 + 41 + 42; Conservation & development = lines 26 + 43.
GDP, 1929 to 202:IEA NIPA Table 1.1.5 Gross Domestic Product, calendar-year nominal. Same API accession date.
BEA's Federal Nondefense view doesn't separately break out water systems or sewer. Those are bundled into "Other" along with lodging, religious, communication, sewage, and waste disposal. State and local water and sewer (lines 41 and 42) are reported separately and dominate the all-government total (state and local does about 95% of US public water and sewer investment), so the federal omission moves the numbers by a tiny amount.
2025 annual figures aren't yet published by BEA. Table 5.9.5 is annual-frequency and updates months after year end. BEA is expected to release 2025 NIPA detail around Sep 2026.
Period markers
War periods provided as context as background coloured bars, the policy eras marked underneath with square brackets are the periods that drove investment spending.
War periods (background bands)
WWII (1941–1945). Pacific and European theatre. Civilian construction got reallocated to war production. Infrastructure investment crashed to its all-time low of about 0.25% of GDP.
Korea (1950–1953). Korean War. Modest impact on domestic infrastructure; postwar recovery was already in motion and the Interstate era was three years away.
Vietnam (1965–1973). US combat in Southeast Asia. Overlaps with the late Interstate era and the launch of Great Society (Lyndon B. Johnson 1964-68) programs. Competing budget pressure on domestic capital spending.
Reagan (1981–1989). Cold War defence build-up. Overlaps with the end of the post-Interstate infrastructure plateau and the start of the long decline in GDP share.
GWOT (2001–2011). Global War on Terror: Iraq and Afghanistan operations. Federal infrastructure investment held roughly steady; state and local picked up. The ARRA stimulus (2009 to 2011) overlaps the tail end.
Infrastructure-policy eras (bracket markers below the x-axis)
New Deal (1933–1939). Roosevelt's response to the Great Depression. The PWA (Public Works Administration), WPA (Works Progress Administration), TVA (Tennessee Valley Authority), and CCC(Civilian Conservation Corps) poured federal dollars into dams, roads, schools, and rural electrification. Drove infrastructure investment to its all-time GDP-share peak: 3.17% in 1936.
Interstate era (1956–1972). The Federal-Aid Highway Act of 1956 created the Highway Trust Fund and authorised the Interstate Highway System: 41,000 miles of limited-access freeway, paid for by federal fuel taxes on a 90/10 federal-to-state cost share. Annual highway investment roughly doubled between 1956-68from 4.4B to 8.7B. (but of course this is relatively flat as a percentage of GDP, and the actual number increase is hard to see on the scale we're looking at here. )
Great Scociety Lindon B Johnson's domestic policy agenda. I initially didn't include this, but I was very interested in the seeming reduction in infrastructure spending. This policy agenda moved federal spending to social programs and away from physical infrastructure. e.g. Civil Rights act (1964) outlawed segregation in public accommodations and employment. Food Stamp Act made the food stamp pilot a permanent program. Medicare/medicaid created in 1965 along with the Voting Rights Act, Head Start, Elementary and Secondary Education Act and the Higher Education Act. Also the Housing and Urban Development Act (also 1965) expanded federal housing programs and added rent subsidies.
Clean Water Act (1972–1980). The Federal Water Pollution Control Act amendments of 1972 created the Construction Grants Program, which gave federal cost share for sewer and wastewater-treatment plant construction. Peaked in the late 1970s and got replaced in 1987 by the State Revolving Fund (a loan programme rather than direct grants).
ARRA (2009–2011). American Recovery and Reinvestment Act: $831B Obama-administration stimulus, of which roughly $100B was tagged for infrastructure. A counter-cyclical capital push during the post-2008 recession.
IIJA (2021–2024). Infrastructure Investment and Jobs Act: $1.2T five-year bipartisan law, of which $550B is new spending above baseline. The biggest single infrastructure law since the Interstate era.
by Whitehatnetizen
1 Comment
Government gross investment in structures, 1929 to 2024.
**Data Sources – Table data**
**BEA NIPA Table 5.9.5 Gross Government Fixed Investment by Type**. Accessed via the BEA Data API. The table publishes Federal Nondefense and State-and-Local structures separately, broken out by structure type. ([apps.bea.gov](https://apps.bea.gov/iTable/?reqid=19&step=2&isuri=1&categories=survey#eyJhcHBpZCI6MTksInN0ZXBzIjpbMSwyLDNdLCJkYXRhIjpbWyJjYXRlZ29yaWVzIiwiU3VydmV5Il0sWyJOSVBBX1RhYmxlX0xpc3QiLCI0MDAiXV19))
The four segments on the chart sum the relevant federal and state-and-local lines into all-government totals. Federal Defense structures (military bases and so on) are excluded entirely as these would come under a “military spending” budget
**Segment mapping:** Highways & streets = lines 25 + 40; Other transport (transit, air, water) = lines 23 + 38; Utilities (power, water, sewer) = lines 24 + 39 + 41 + 42; Conservation & development = lines 26 + 43.
**GDP, 1929 to 202:IEA NIPA Table 1.1.5** Gross Domestic Product, calendar-year nominal. Same API accession date.
BEA’s Federal Nondefense view doesn’t separately break out water systems or sewer. Those are bundled into “Other” along with lodging, religious, communication, sewage, and waste disposal. State and local water and sewer (lines 41 and 42) are reported separately and dominate the all-government total (state and local does about 95% of US public water and sewer investment), so the federal omission moves the numbers by a tiny amount.
2025 annual figures aren’t yet published by BEA. Table 5.9.5 is annual-frequency and updates months after year end. BEA is expected to release 2025 NIPA detail around Sep 2026.
**Period markers**
War periods provided as context as background coloured bars, the policy eras marked underneath with square brackets are the periods that drove investment spending.
**War periods (background bands)**
**WWII (1941–1945)**. Pacific and European theatre. Civilian construction got reallocated to war production. Infrastructure investment crashed to its all-time low of about 0.25% of GDP.
**Korea (1950–1953)**. Korean War. Modest impact on domestic infrastructure; postwar recovery was already in motion and the Interstate era was three years away.
**Vietnam (1965–1973)**. US combat in Southeast Asia. Overlaps with the late Interstate era and the launch of Great Society (Lyndon B. Johnson 1964-68) programs. Competing budget pressure on domestic capital spending.
**Reagan (1981–1989)**. Cold War defence build-up. Overlaps with the end of the post-Interstate infrastructure plateau and the start of the long decline in GDP share.
**GWOT (2001–2011)**. Global War on Terror: Iraq and Afghanistan operations. Federal infrastructure investment held roughly steady; state and local picked up. The ARRA stimulus (2009 to 2011) overlaps the tail end.
**Infrastructure-policy eras (bracket markers below the x-axis)**
**New Deal (1933–1939)**. Roosevelt’s response to the Great Depression. The PWA (Public Works Administration), WPA (Works Progress Administration), TVA (Tennessee Valley Authority), and CCC(Civilian Conservation Corps) poured federal dollars into dams, roads, schools, and rural electrification. Drove infrastructure investment to its all-time GDP-share peak: 3.17% in 1936.
**Interstate era (1956–1972)**. The Federal-Aid Highway Act of 1956 created the Highway Trust Fund and authorised the Interstate Highway System: 41,000 miles of limited-access freeway, paid for by federal fuel taxes on a 90/10 federal-to-state cost share. Annual highway investment roughly doubled between 1956-68from 4.4B to 8.7B. (but of course this is relatively flat as a percentage of GDP, and the actual number increase is hard to see on the scale we’re looking at here. )
**Great Scociety** Lindon B Johnson’s domestic policy agenda. I initially didn’t include this, but I was very interested in the seeming reduction in infrastructure spending. This policy agenda moved federal spending to social programs and away from physical infrastructure. e.g. Civil Rights act (1964) outlawed segregation in public accommodations and employment. Food Stamp Act made the food stamp pilot a permanent program. Medicare/medicaid created in 1965 along with the Voting Rights Act, Head Start, Elementary and Secondary Education Act and the Higher Education Act. Also the Housing and Urban Development Act (also 1965) expanded federal housing programs and added rent subsidies.
**Clean Water Act (1972–1980)**. The Federal Water Pollution Control Act amendments of 1972 created the Construction Grants Program, which gave federal cost share for sewer and wastewater-treatment plant construction. Peaked in the late 1970s and got replaced in 1987 by the State Revolving Fund (a loan programme rather than direct grants).
**ARRA (2009–2011)**. American Recovery and Reinvestment Act: $831B Obama-administration stimulus, of which roughly $100B was tagged for infrastructure. A counter-cyclical capital push during the post-2008 recession.
**IIJA (2021–2024)**. Infrastructure Investment and Jobs Act: $1.2T five-year bipartisan law, of which $550B is new spending above baseline. The biggest single infrastructure law since the Interstate era.