
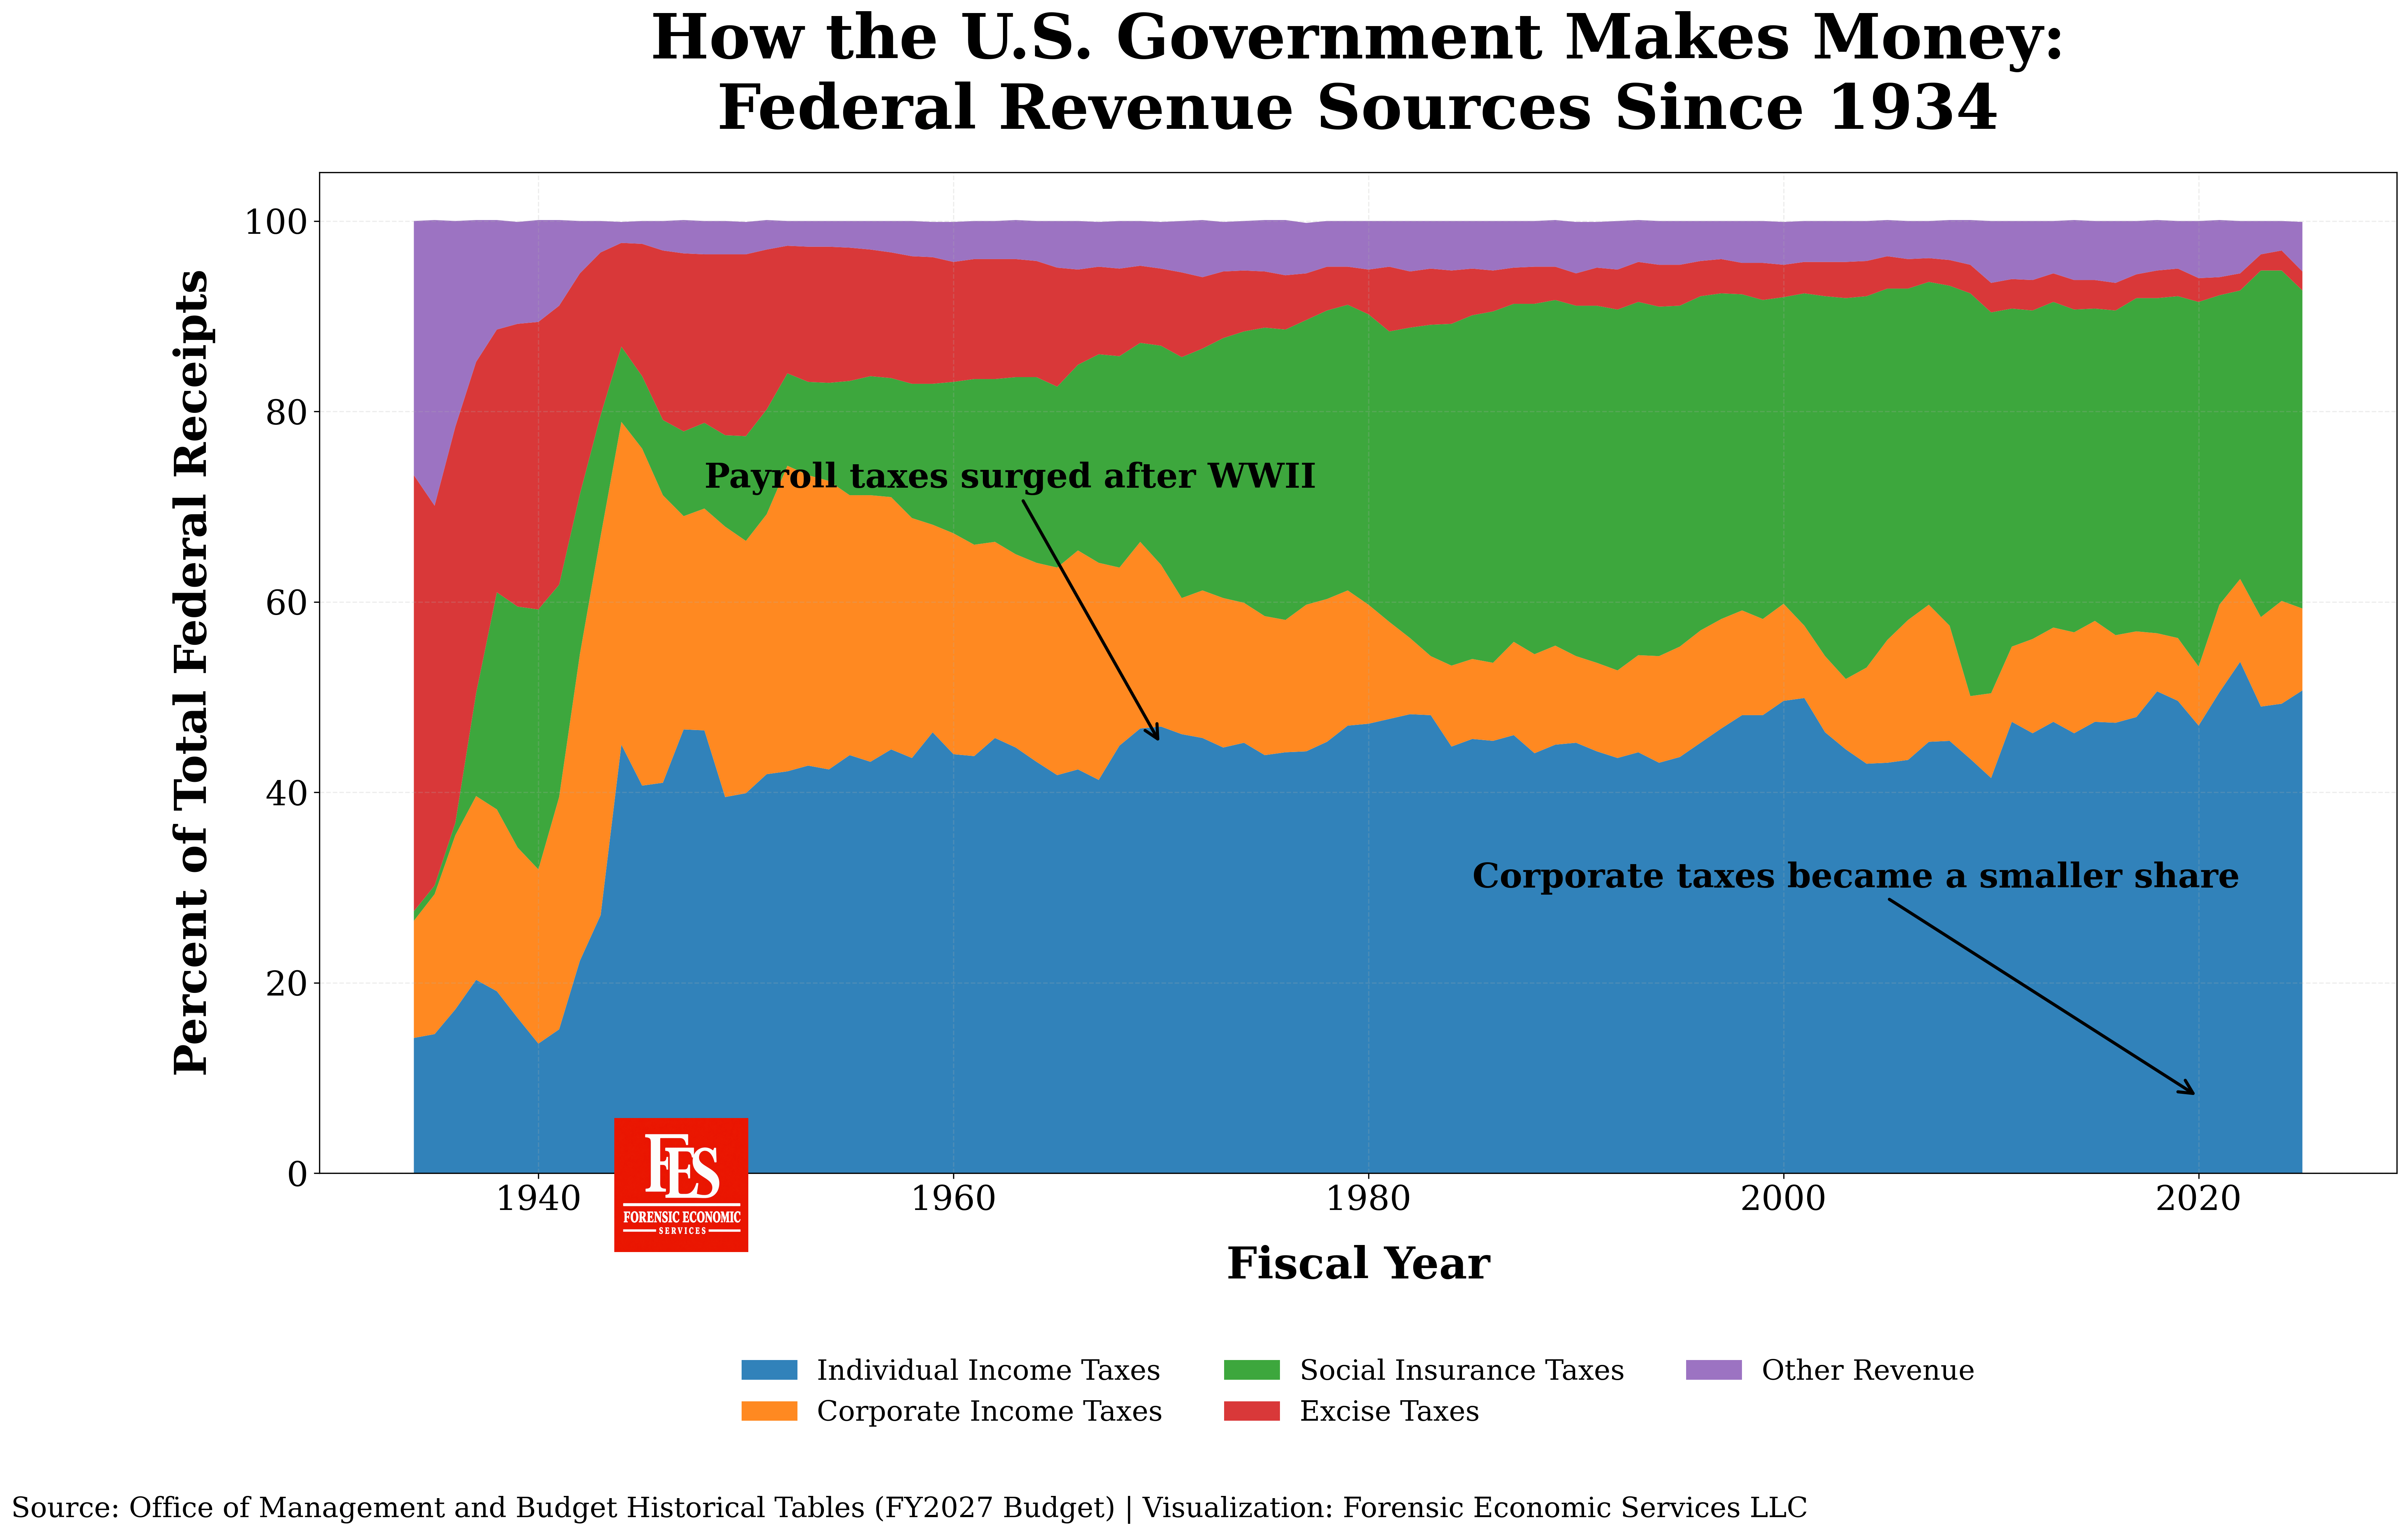
Source: Office of Management and Budget Historical Table
Made with R / ggplot2 using data from the Office of Management and Budget Historical Tables, FY2027 Budget, Table 2.2: Percentage Composition of Receipts by Source.
Source: https://www.govinfo.gov/app/details/BUDGET-2027-TAB/BUDGET-2027-TAB-3-2
This chart shows how federal revenue has shifted over time. Individual income taxes became the largest source of receipts, payroll taxes grew substantially after World War II, and corporate income taxes became a much smaller share of total federal revenue.
Visualization: Forensic Economic Services LLC | Rule703.com
Would love feedback from the community on both the visualization and the historical interpretation.
by forensiceconomics
2 Comments
really messed up your labeling there buddy
Is this gross dollar? Net?. Do number of receipts= total number of corporate vs non vs personal tax payer?