
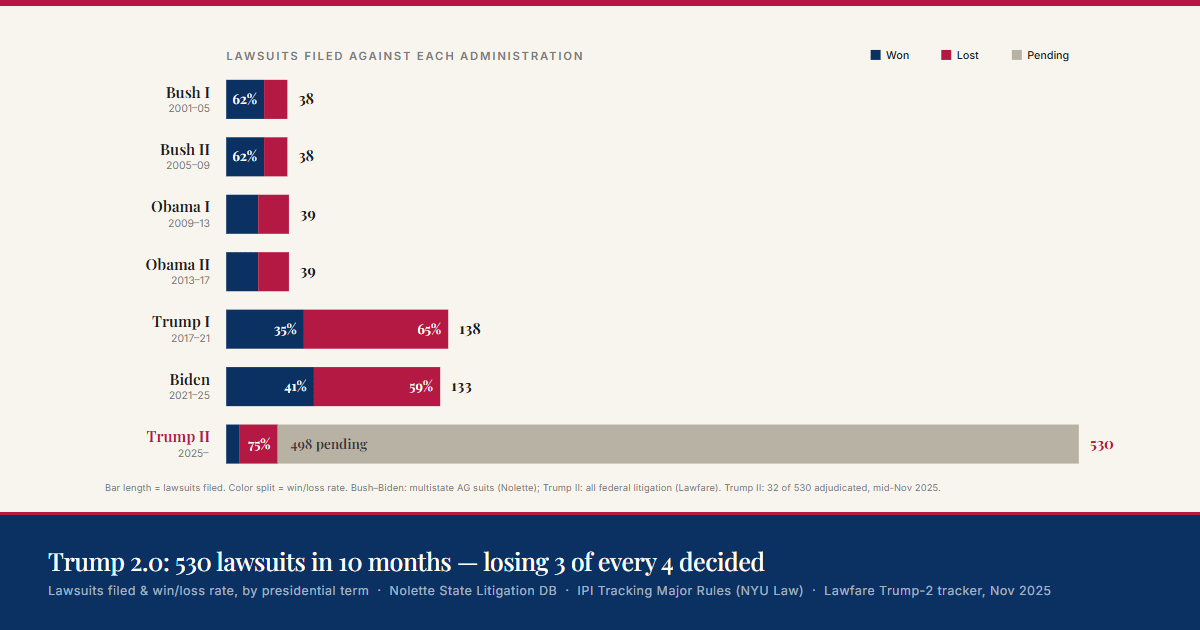
For anyone confused by "multistate AG lawsuits" and "major rule challenges":
When a US president signs executive orders, or has agencies (EPA, ICE, IRS, Education Department, etc.) write new rules, people who don't like those rules can sue the federal government in court to block them. The chart is about how often each administration gets sued over its policies, and how often they lose those cases. It does not include lawsuits the administration itself filed (the DOJ suing states, companies, or individuals), criminal cases or civil suits against the president personally, ethics complaints, impeachment proceedings, or anything not aimed at blocking a federal policy or rule.
Bar length,how often they got sued
For Bush through Biden, the numbers come from Paul Nolette's database at Marquette, which tracks "multistate" lawsuits; cases where attorneys general from several states team up to sue the federal government. Think: 18 Democratic state AGs jointly suing the EPA over a Trump rule, or 20 Republican AGs jointly suing Biden over a vaccine mandate. These are the highest-profile cases and a clean apples-to-apples count across administrations.
For Trump 2, the 530 number is broader. It includes every federal lawsuit filed against the administration so far, tracked by Lawfare and Just Security; not just multistate ones. So the comparison isn't perfectly clean, but Trump 2 is also on pace to break the multistate-only record. The point holds.
Color split; how the courts ruled
"Lost" means a federal court struck down or blocked the rule the administration was defending. "Won" means the rule held up in court. These percentages come from NYU's Institute for Policy Integrity, which has tracked every major federal regulation since 1996. The long-term baseline is around 60–70% wins. Trump 1 collapsed to 35%; the worst on record at the time. Biden recovered slightly (41%). Trump 2 is currently at 25% wins on cases that have actually been decided.
Why Trump 2's bar is mostly gray
Federal court cases take 1–3 years to finish. The data is as of November 2025, so only 10 months of data for Trump 2. Of the ~530 cases filed, only 32 have been fully decided so far (8 won, 24 lost). The other 498 are still moving through the courts. The gray "pending" segment is the "we don't know yet" portion, give it another year or two before drawing strong conclusions about the 75% loss rate.
Caveat on the chart itself: Bush and Obama served two terms each, but the underlying dataset (IPI) tracks win rates per administration, not per term. Both their bars show the same rate within an administration; that's a limitation of the source.
Sources: Paul Nolette's State Litigation & AG Activity Database (Marquette University), Institute for Policy Integrity "Tracking Major Rules" (NYU School of Law), Lawfare's Trump Administration Litigation Tracker, Just Security litigation tracker (all numbers as of mid-November 2025).
by Fun_Resident3967
3 Comments
**TL;DR**: Bars show how many times each administration was sued over its policies; color shows how often the courts struck those policies down. Trump 2’s bar is mostly gray because only 32 of his ~530 cases have actually been decided so far; and 3 of every 4 of those went against him. Doesn’t include criminal cases, lawsuits against the president personally, or lawsuits the administration itself filed. **Sources**: Paul Nolette’s State Litigation Database (Marquette), Institute for Policy Integrity (NYU Law), and Lawfare’s Trump Administration Litigation Tracker. **Tool**: Chart hand-coded by me in D3.js.
Give us the Obama percentages you coward
The phrasing could be clearer. When I read “x% of lawsuits against the administration were won”, I assumed won by the one filing it, but apparently it means the opposite