
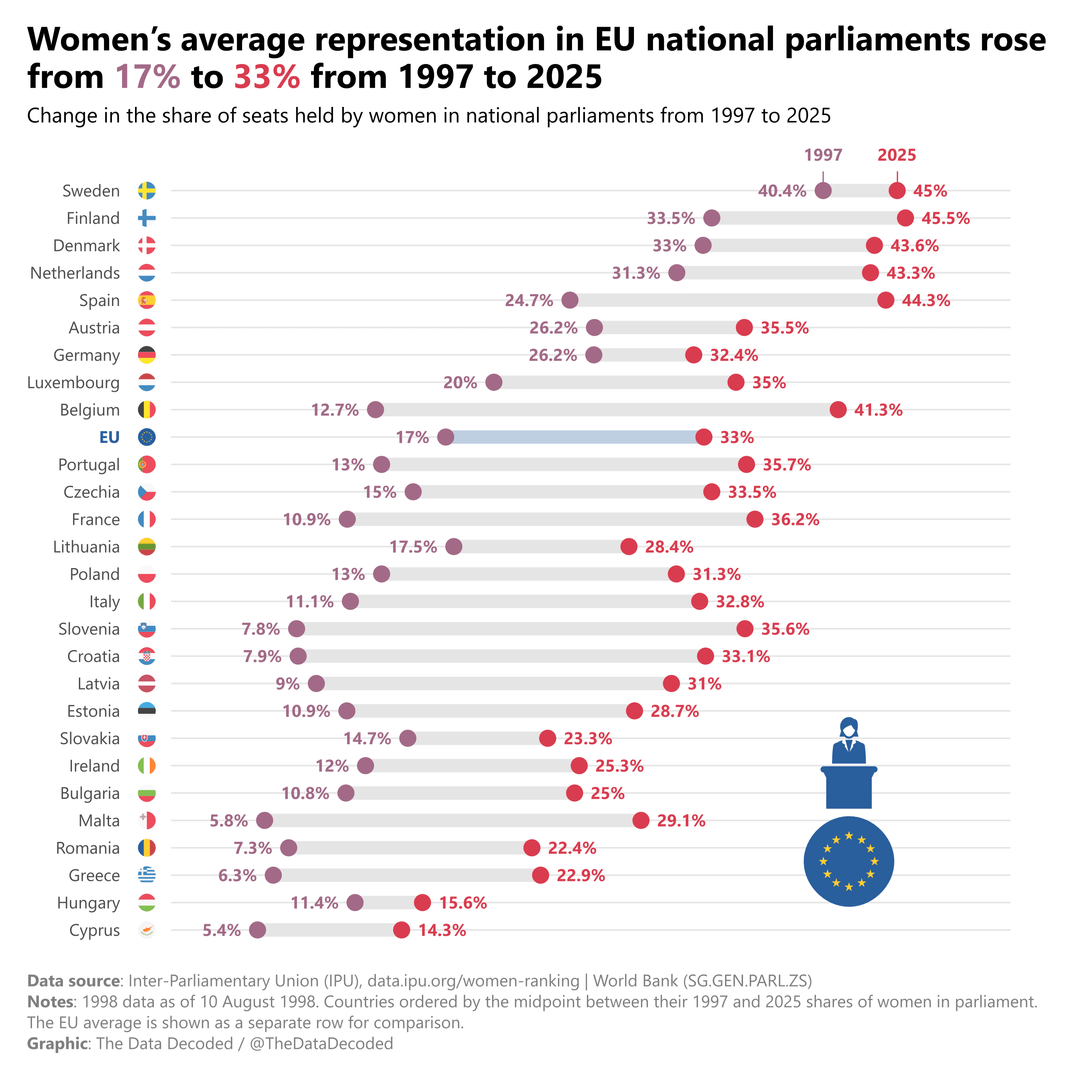
Women's representation in national parliaments across the European Union increased from an average of 17% in 1997 to 33% in 2025.
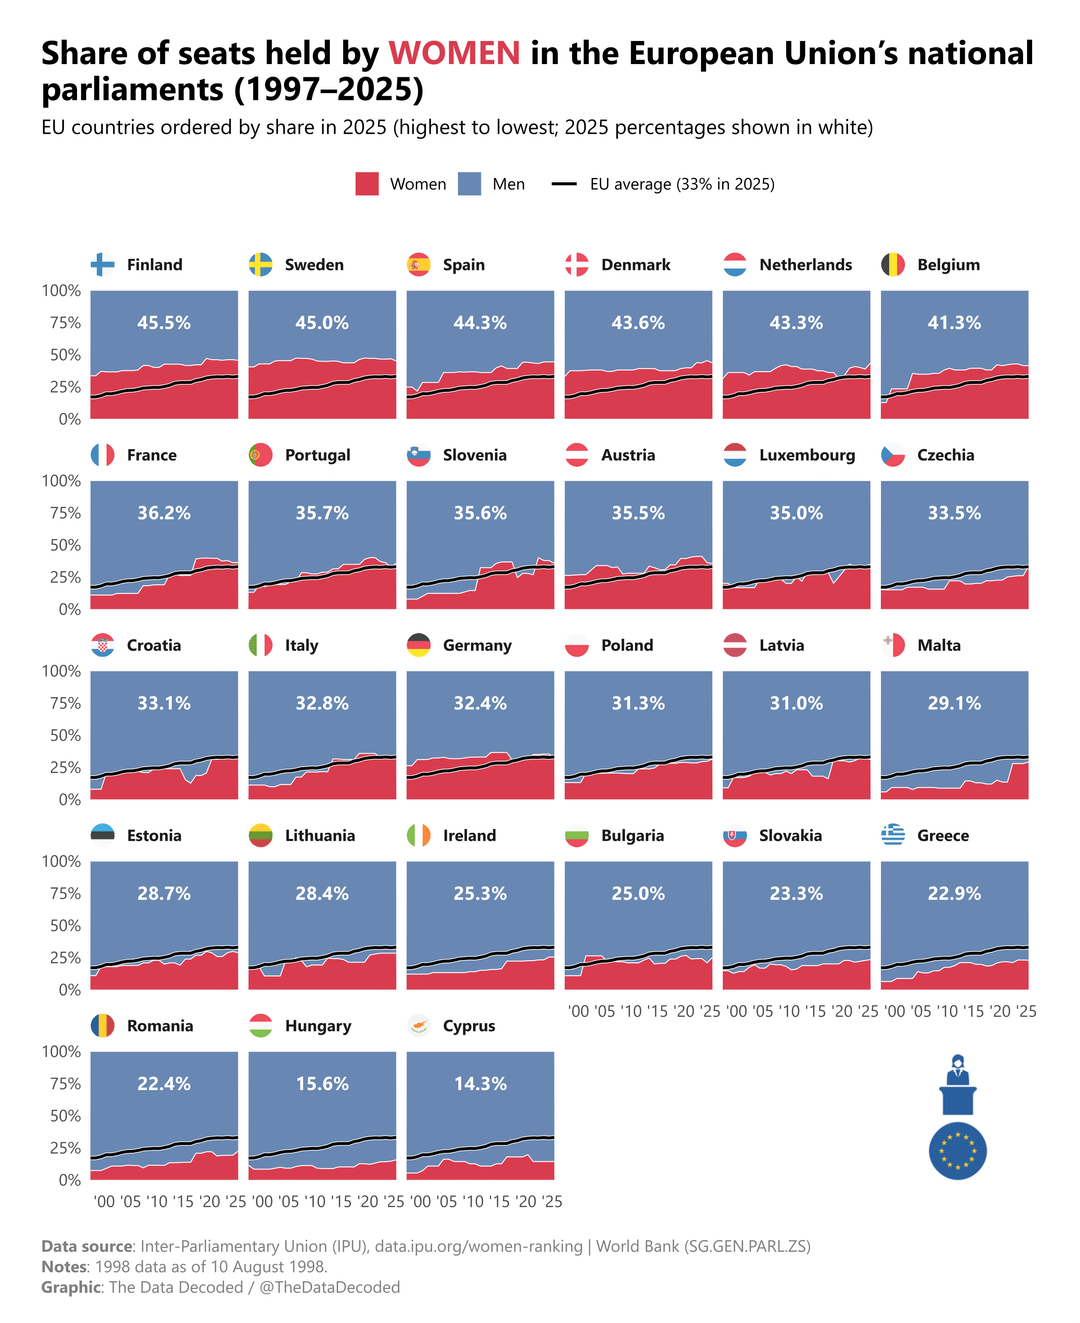
The Nordic countries continue to lead the EU, with Finland and Sweden both above 45%, while several Southern and Central/Eastern European countries still remain below 25%.
The first chart (dumbbell chart) compares the starting point (1997) with the latest available data (2025).
The second chart (stacked area chart) shows the full evolution from 1997-2025 for each EU country, ordered by 2025 share.
A few observations:
- Finland now has the highest share of women in parliament in the EU (45.5%)
- Belgium saw one of the largest long-term increases (12.7% to 41.3%)
- Hungary and Cyprus remain the lowest in the EU
Most countries show a clear long-term upward trend, though progress has often been gradual rather than linear.
by Low-Car6464
4 Comments
**Data source**: Inter-Parliamentary Union (IPU) / World Bank
**Tools used**: R (ggplot2, dplyr), RStudio
@ TheDataDecoded on X (Twitter)
wtf is that graph ordered by??? its not ordered by the past values or the current!
just to add, the new Hungarian parliament has 54 women, 51 of them in the governing Tisza party
edit: out of 199
How many countries made laws that political parties need to have better gender quotas in the last 2 decades? Aren’t Nordic countries famous for that?