
Methodology
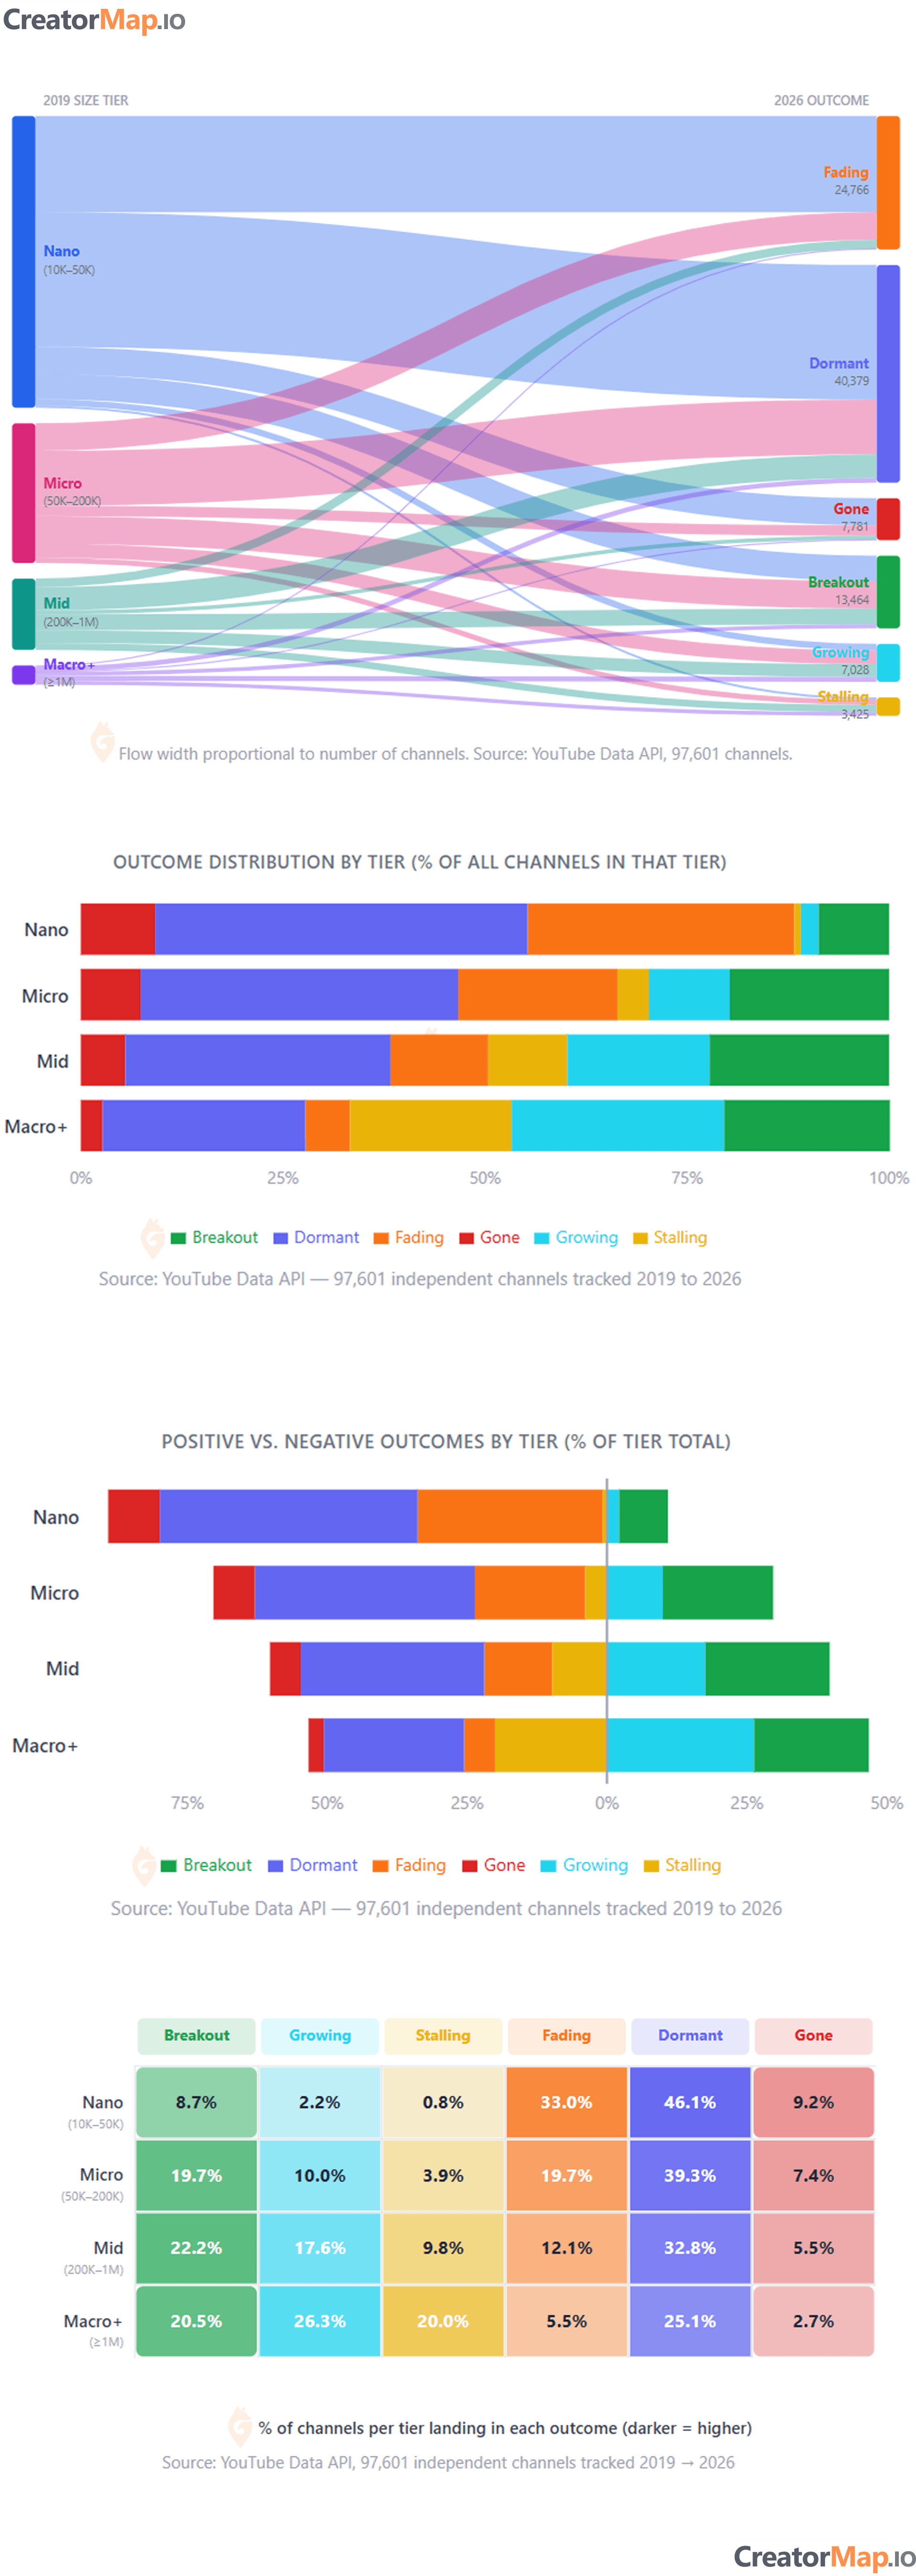
I started with a dataset of ~100K (97,601) independent YouTube channels from 2019, then pulled refreshed data on each one via the YouTube Data API in 2026 to measure what had changed. Channels were grouped by their 2019 subscriber count into four size tiers: Nano (10K–50K), Micro (50K–200K), Mid (200K–1M), and Macro+ (1M+).
Each channel was then classified into one of six outcomes:
- Breakout: still actively posting, subscribers at least doubled since 2019 (≥2×)
- Growing: still actively posting, subscribers up 20–100% since 2019
- Stalling: still actively posting, subscribers less than 20% higher than 2019
- Fading: still posting, but averaging fewer than 2,500 views per video across their last 5 uploads, the algorithm has effectively stopped recommending them
- Dormant: no upload in 180+ days
- Gone: channel deleted, no videos present, or inaccessible via the API
Data source: YouTube Data API v3. Only independent creator channels were included: brand accounts, news outlets, and channels with fewer than 10K subscribers in 2019 were excluded.
The nature of Subscriptions on youtube means that its rare that there is significant decline in subscriptions, it's usually viewership which will decline and then that leads to a channel going dormant. I did not have average views data for 2019, so I did the best I could with the subscription data.
Personal note: my own channel falls squarely in the Stalling category and is probably headed Dormant soon. Sometimes you build the study and then realise you're one of the data points. This was done as part of CreatorMap.
by EmptySetAi
4 Comments
**Data source:** The 2019 channel list came from a pre-existing dataset of independent YouTube creators. The 2026 figures were pulled fresh via the YouTube Data API v3 subscriber counts, upload history, and recent video view counts were all queried directly from the API at time of analysis.
**Visualisation:** The charts on the full write-up are built with Recharts (the stacked and diverging bar charts) and d3-sankey (the flow diagram).
No sure subscriber count is as good a metric as it used to be. Views might be better.
I wonder what is the overlap between Breakout and Fading, there has to be a few channels that doubled their subscribers and yet are averaging less than 2500 views.
Anyway great chart, please make one based entirely on views but it might be hard since shorts channels will have very high views compared to long format content yet i won’t consider most of these shorts channels successful.
Why is the legend not in the order of the bands? 🙁