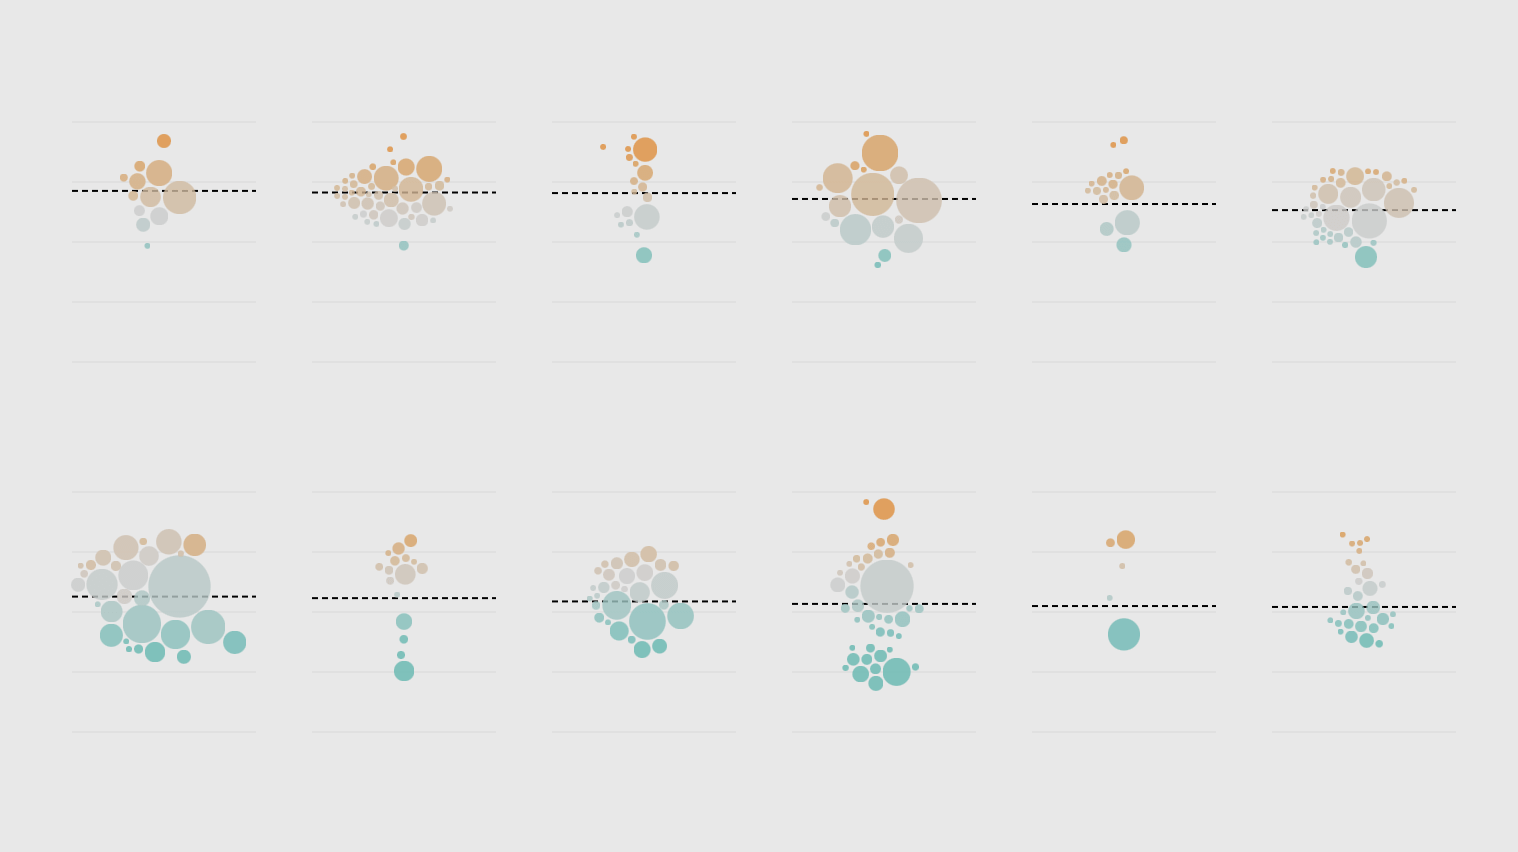
Share Facebook Twitter LinkedIn Pinterest Bluesky Threads Occupations with the Highest Divorce Rates, 2026 by rhiever
99kemo on May 8, 2026 5:49 pm Lower income people get divorced at a much higher rate than higher income people. This is a well documented fact.
mkp666 on May 8, 2026 5:55 pm This data should really be controlled for age. A 50 year old is much more likely to have been divorced than a 25 year old regardless of anything else.
TheReaperSovereign on May 8, 2026 5:56 pm Construction feels low to me as someone in the industry Also would have loved to see military data lol
Moist_Ordinary6457 on May 8, 2026 6:05 pm Interesting that Pharmacists and Phlebotomists are at opposite ends of the chart, I would’ve thought they’d be similar
MightyPlasticGuy on May 8, 2026 6:08 pm Pretty fascinating how at both total ends of the spectrum are varying types of Healthcare practitioners.
PancAshAsh on May 8, 2026 6:13 pm Biggest commonality among those at the top of the chart is the night shift.
No_Help7183 on May 8, 2026 6:13 pm Now correlate it with working hours. Traditional 9-5 vs shift work etc. I bet that’s a leading factor there.
Botherguts on May 8, 2026 6:16 pm Near the very top is massage therapist and near the very bottom is physical therapist.
lollipoppizza on May 8, 2026 6:17 pm It’s very amusing to me that actuaries have by far the lowest divorce rate.
justafang on May 8, 2026 6:29 pm I work in healthcare and do side hustle in transportation, no wonder my marriage failed 😂
Kilgore48 on May 8, 2026 6:30 pm Contrary to popular…music… cowboys have lower divorce rates than doctors, lawyers, and such.
gman2093 on May 8, 2026 6:31 pm Surgeons at 20.8 percent only slightly higher than physicians at 20.1 is surprising to me, I guess I have seen too much hospital drama TV

17 Comments
I would love to see this controlled for income
Lower income people get divorced at a much higher rate than higher income people. This is a well documented fact.
This data should really be controlled for age. A 50 year old is much more likely to have been divorced than a 25 year old regardless of anything else.
Construction feels low to me as someone in the industry
Also would have loved to see military data lol
How about unemployed, former software developers?
Hard to understand these bubbles. WTH.
Interesting that Pharmacists and Phlebotomists are at opposite ends of the chart, I would’ve thought they’d be similar
Pretty fascinating how at both total ends of the spectrum are varying types of Healthcare practitioners.
Biggest commonality among those at the top of the chart is the night shift.
Now correlate it with working hours. Traditional 9-5 vs shift work etc. I bet that’s a leading factor there.
Near the very top is massage therapist and near the very bottom is physical therapist.
It’s very amusing to me that actuaries have by far the lowest divorce rate.
what is the divorce rate for russian occupation ?
Software developers dont get divorced, yeah duh!
I work in healthcare and do side hustle in transportation, no wonder my marriage failed 😂
Contrary to popular…music… cowboys have lower divorce rates than doctors, lawyers, and such.
Surgeons at 20.8 percent only slightly higher than physicians at 20.1 is surprising to me, I guess I have seen too much hospital drama TV