[OC] The US companies with the most warehouse space – Remix with better visuals of my older post
by VeridionData

[OC] The US companies with the most warehouse space – Remix with better visuals of my older post
by VeridionData
3 Comments
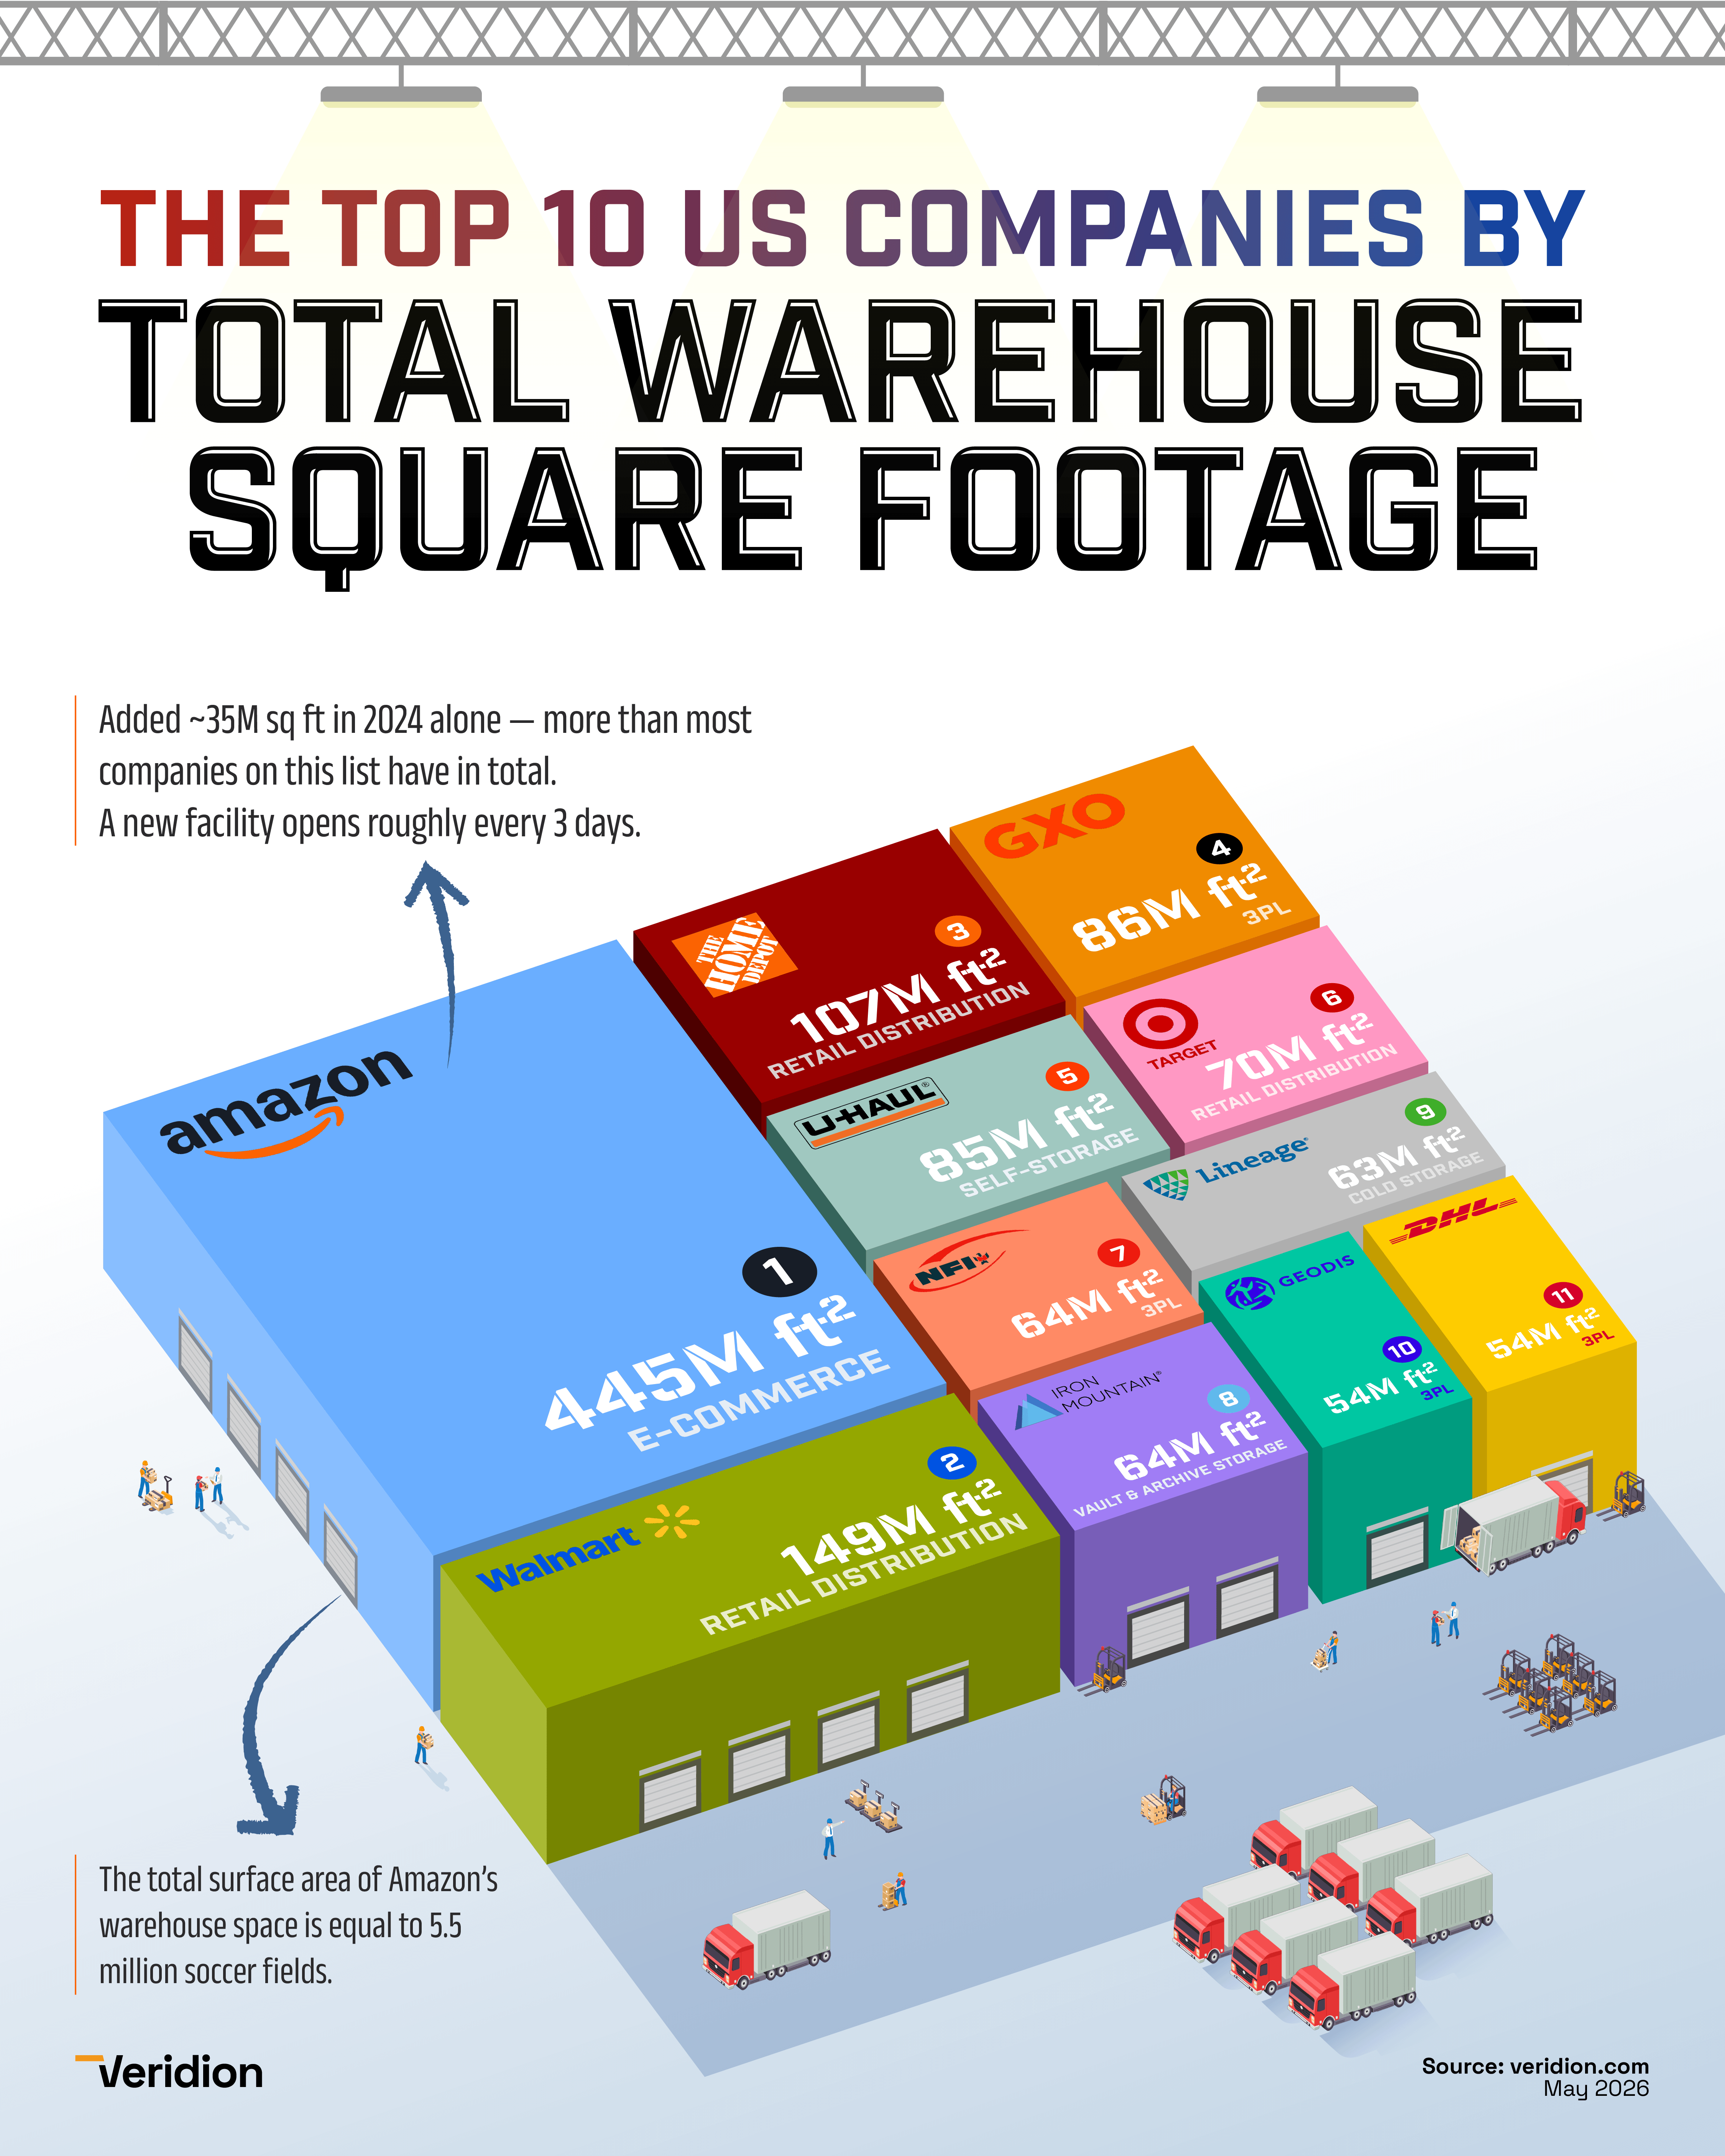
Data source: Each square-footage figure is derived from Veridion’s business and location-based data. Veridion aggregates information from multiple sources (SEC 10-K filings, company websites, real estate disclosures, satellite imagery, government registries) and infers each facility’s footprint by cross-checking against related signals such as building outlines from satellite imagery, parcel records, industrial zoning, and operator disclosures. Cross-checked against SEC 10-K filings, Green Street Industrial Sector Update 2024, MWPVL, and Modern Materials Handling.
Methodology: Each company’s US warehouse footprint was assembled by resolving each industrial facility in Veridion’s location graph to its operating company, then summing per-facility square-footage estimates by operator. Entity resolution makes sure a distribution center owned by “Amazon Services LLC” rolls up to the Amazon parent and doesn’t get double-counted with an adjacent fulfillment center. Where a company operates a clustered campus under multiple subsidiary entities (common with 3PLs and Amazon’s sortation + fulfillment + delivery station stack), the contiguous facilities are consolidated under the parent. Counts reflect active facilities as of May 2026; all figures are estimates with a margin of uncertainty.
Tools: Python for data processing, Figma for visualization
It says “amazon added ~35M sq ft, more than most companies on this list have in total”, however according to your image, the lowest size on the list is 54M sq ft.
Did not know DHL (German Giant) is that big in the USA.