[OC] The aging of the U.S. Congress (and everyone else)
**Gist:**
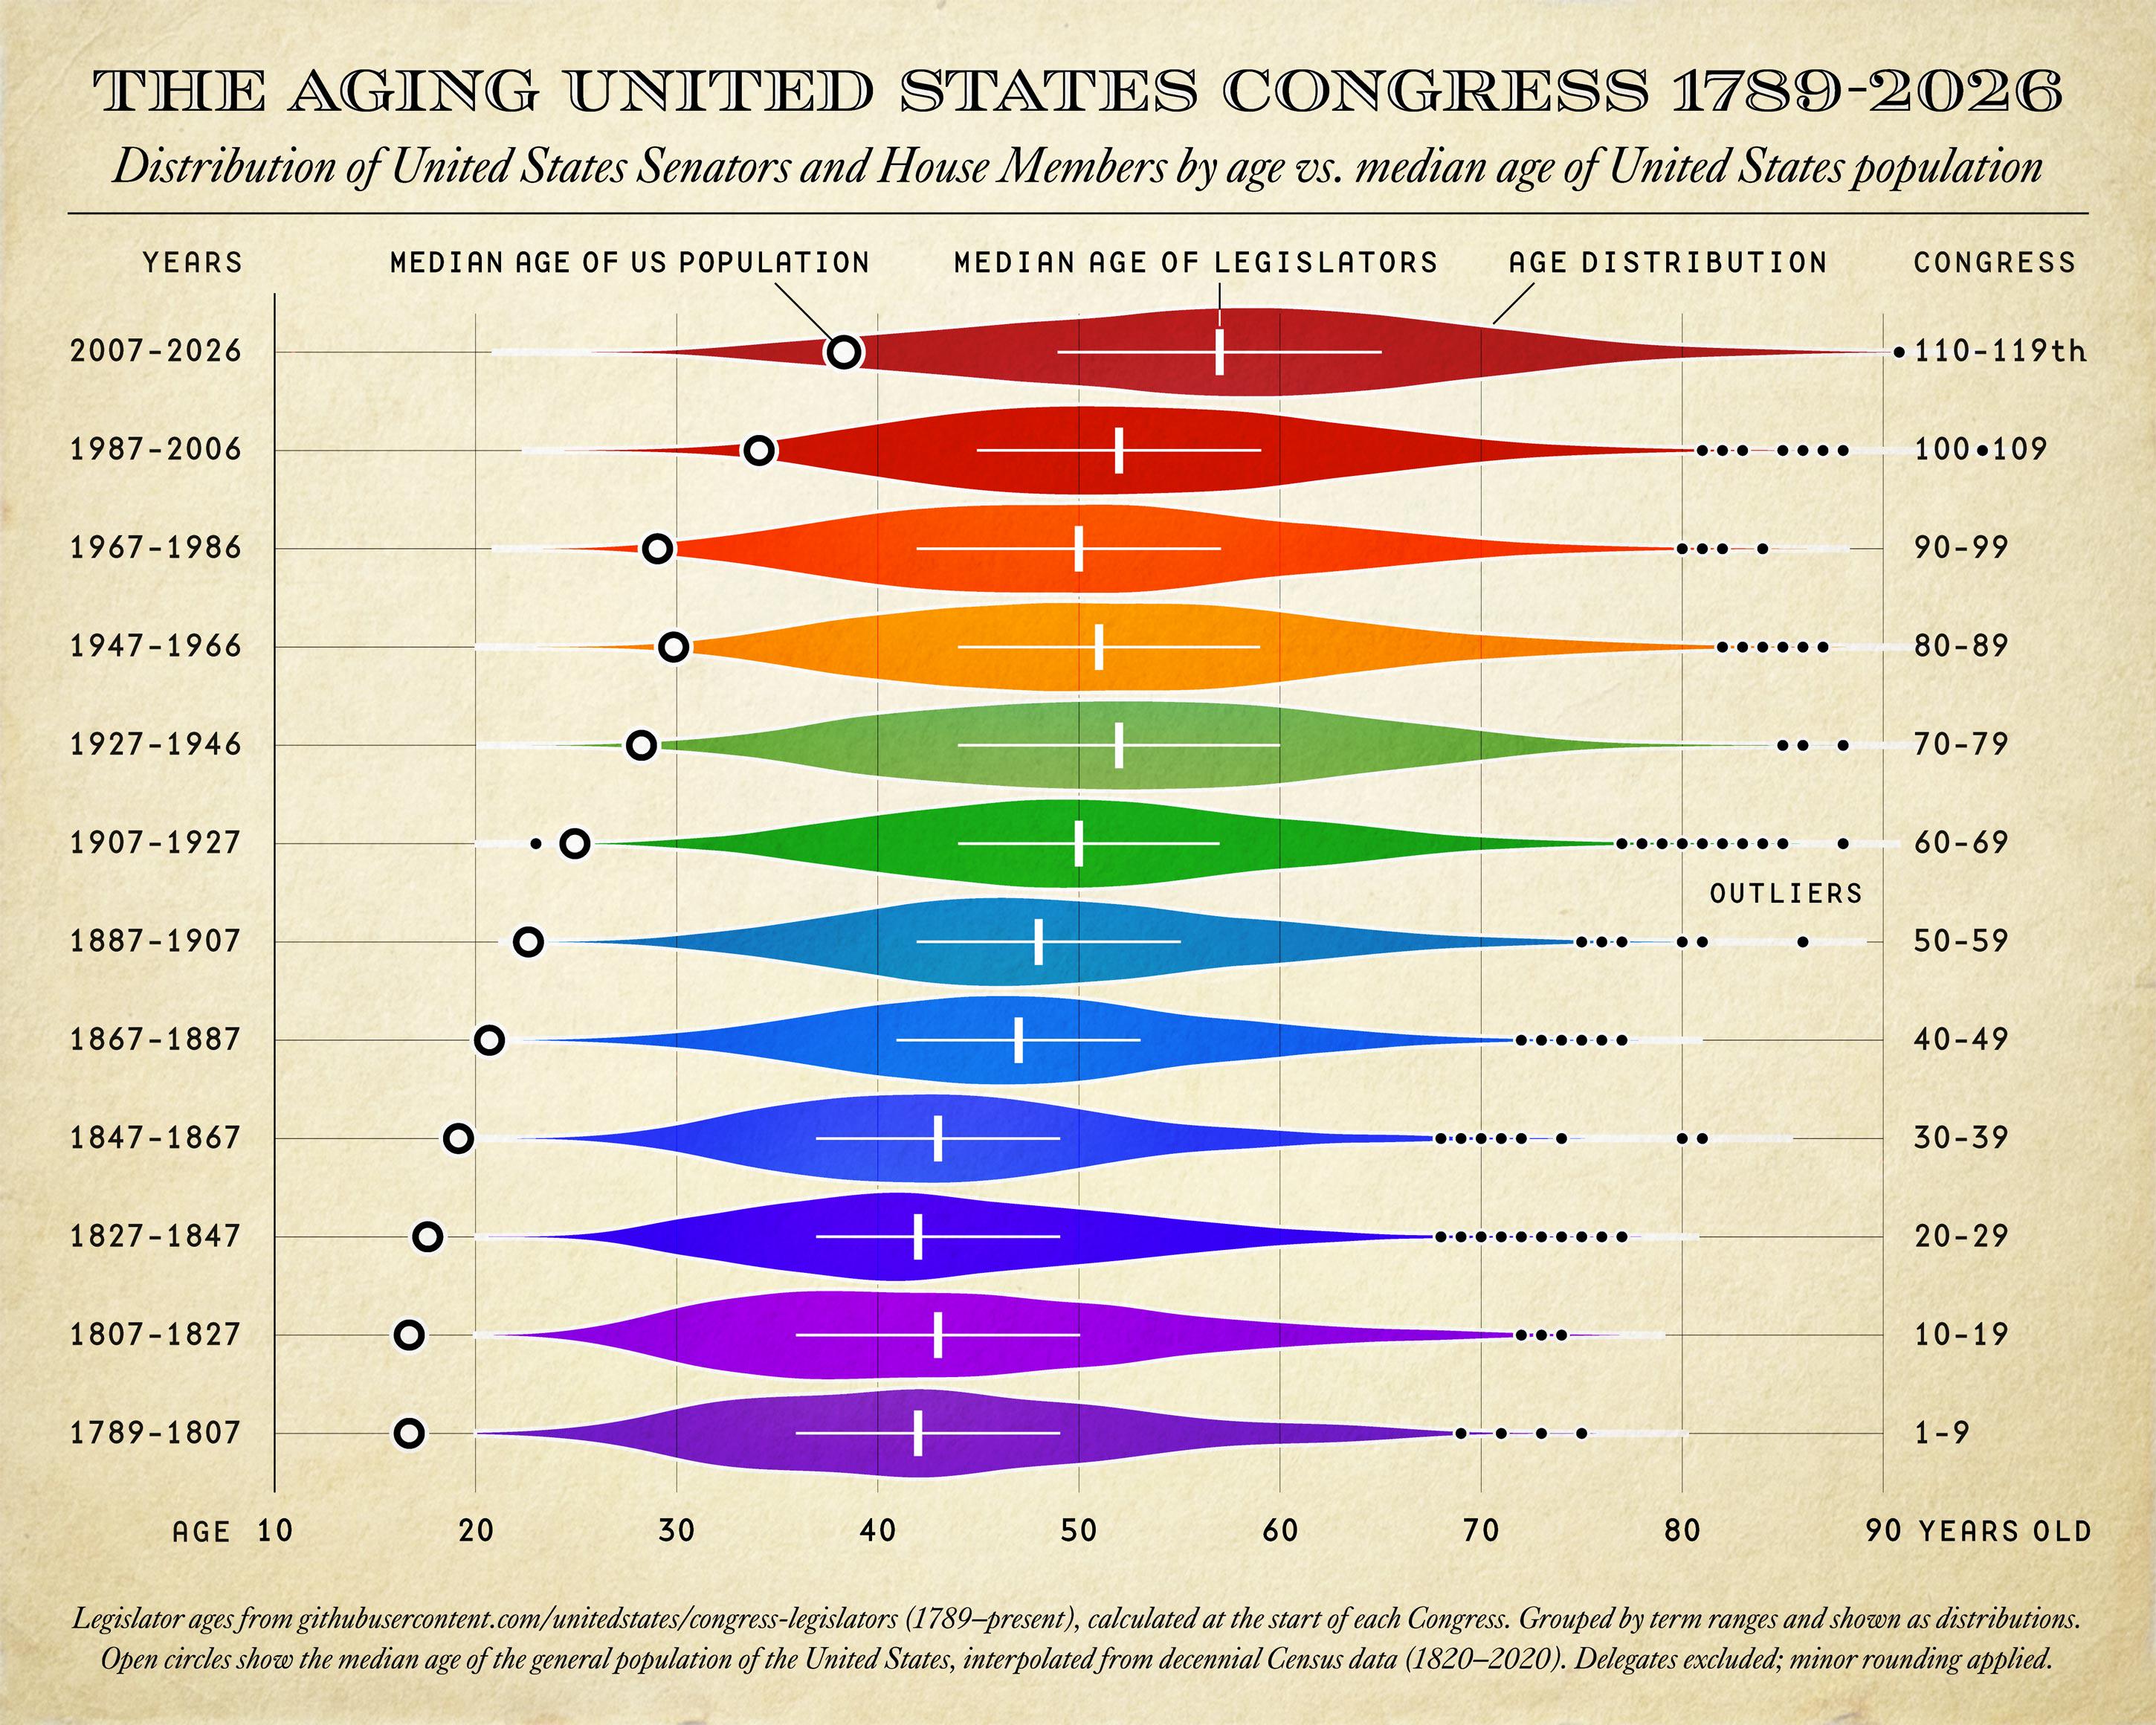
Members of the U.S. Congress have long been the elders of the population they represent. While both have aged over time, the gap remains substantial and seems particularly noticeable in recent decades, though perhaps because elder states-people are hitting the ceiling of life expectancy.
**Detail:**
Each row shows the age distribution of Senators and House members at the start of grouped Congress terms (e.g., 1–9, 10–19, …, 110–119). The colored shapes represent the full distribution, with the white bar marking the interquartile range and the central tick indicating the median age of legislators. Open circles show the median age of the U.S. population for the same period, interpolated from decennial Census data. The persistent separation between these markers highlights a long-standing representational age gap, particularly noticeable in the modern era.
* Legislator ages are calculated at the **start date of each Congress** using birthdates and term records.
* Only **voting members (House + Senate)** are included; delegates are excluded.
* Congresses are grouped into ranges (e.g., 1–9, 10–19, …, 110–119) to stabilize distributions.
* Age distributions are visualized as kernel densities; medians and interquartile ranges are overlaid.
* U.S. population median age is estimated at the midpoint year of each group’s time span by linearly interpolating between decennial Census values.
* Minor rounding applied.
so congress was 2.5x older at 1-9 and by 110+ its only 1.5x older than gen pop – as looking by median
interesting
Dominyck on
So relative to the general population congress is about as young as ever
95percentconfident on
I’d love to see a simple plot of the age gap of the medians.
AdventureMan247 on
Since pay is for life you’d think they would move on after their first term. But NOOO. Theres too much unethical money to be made. Wish that wasn’t true
Tommyblockhead20 on
Would also be nice to see median age of voters.
Mrrandom314159 on
Makes sense.
Federal level congressional offices are likely the end of someone’s political career. It’s goimg to (should) require experience and well…the wisdom that comes with age.
Just so happens that as modern medicine has advanced… we also get some… “some” legislators that are also on the mental decline.
CptnStarkos on
wow, the median age of population was so low…
Makes sense why in old movies there were so many children

8 Comments
[OC] The aging of the U.S. Congress (and everyone else)
**Gist:**
Members of the U.S. Congress have long been the elders of the population they represent. While both have aged over time, the gap remains substantial and seems particularly noticeable in recent decades, though perhaps because elder states-people are hitting the ceiling of life expectancy.
**Detail:**
Each row shows the age distribution of Senators and House members at the start of grouped Congress terms (e.g., 1–9, 10–19, …, 110–119). The colored shapes represent the full distribution, with the white bar marking the interquartile range and the central tick indicating the median age of legislators. Open circles show the median age of the U.S. population for the same period, interpolated from decennial Census data. The persistent separation between these markers highlights a long-standing representational age gap, particularly noticeable in the modern era.
—
**Tools:**
* R (ggplot2, dplyr, tidyr, purrr, lubridate, svglite)
* Adobe Illustrator (final layout, typography, annotation)
—
**Sources:**
* Legislator data:
[https://github.com/unitedstates/congress-legislators](https://github.com/unitedstates/congress-legislators)
* U.S. population median age (decennial Census):
[https://www.census.gov/data/tables/time-series/demo/popest/2010s-national-detail.html](https://www.census.gov/data/tables/time-series/demo/popest/2010s-national-detail.html)
(historical series compiled from Census reports, 1820–2020)
—
**Methods:**
* Legislator ages are calculated at the **start date of each Congress** using birthdates and term records.
* Only **voting members (House + Senate)** are included; delegates are excluded.
* Congresses are grouped into ranges (e.g., 1–9, 10–19, …, 110–119) to stabilize distributions.
* Age distributions are visualized as kernel densities; medians and interquartile ranges are overlaid.
* U.S. population median age is estimated at the midpoint year of each group’s time span by linearly interpolating between decennial Census values.
* Minor rounding applied.
—
**Data (Medians & Quartiles only):**
“`markdown
| group | Median_Leg | Q1_Leg | Q3_Leg | Median_US |
|———|————|——–|——–|———–|
| 1-9 | 42 | 35.25 | 49 | 16.7 |
| 10-19 | 43 | 36 | 50 | 16.7 |
| 20-29 | 42 | 37 | 49 | 17.62 |
| 30-39 | 43 | 37 | 49 | 19.15 |
| 40-49 | 47 | 41 | 53 | 20.69 |
| 50-59 | 48 | 42 | 55 | 22.63 |
| 60-69 | 50 | 44 | 57 | 24.94 |
| 70-79 | 52 | 44 | 60 | 28.25 |
| 80-89 | 51 | 44 | 59 | 29.85 |
| 90-99 | 50 | 42 | 57 | 29.05 |
| 100-109 | 52 | 45 | 59 | 34.1 |
| 110-119 | 57 | 49 | 65 | 38.32 |
so congress was 2.5x older at 1-9 and by 110+ its only 1.5x older than gen pop – as looking by median
interesting
So relative to the general population congress is about as young as ever
I’d love to see a simple plot of the age gap of the medians.
Since pay is for life you’d think they would move on after their first term. But NOOO. Theres too much unethical money to be made. Wish that wasn’t true
Would also be nice to see median age of voters.
Makes sense.
Federal level congressional offices are likely the end of someone’s political career. It’s goimg to (should) require experience and well…the wisdom that comes with age.
Just so happens that as modern medicine has advanced… we also get some… “some” legislators that are also on the mental decline.
wow, the median age of population was so low…
Makes sense why in old movies there were so many children