If albedo decreases from things like less snow cover or less clouds then the ground heats up more which heats up the atmosphere more which can reduce snow cover etc. This albedo is measured by a satellite measuring outgoing shortwave radiation from the planet and the suns output and working out how much reflection is going on [https://en.wikipedia.org/wiki/Albedo#Terrestrial_albedo](https://en.wikipedia.org/wiki/Albedo#Terrestrial_albedo)

1 Comment
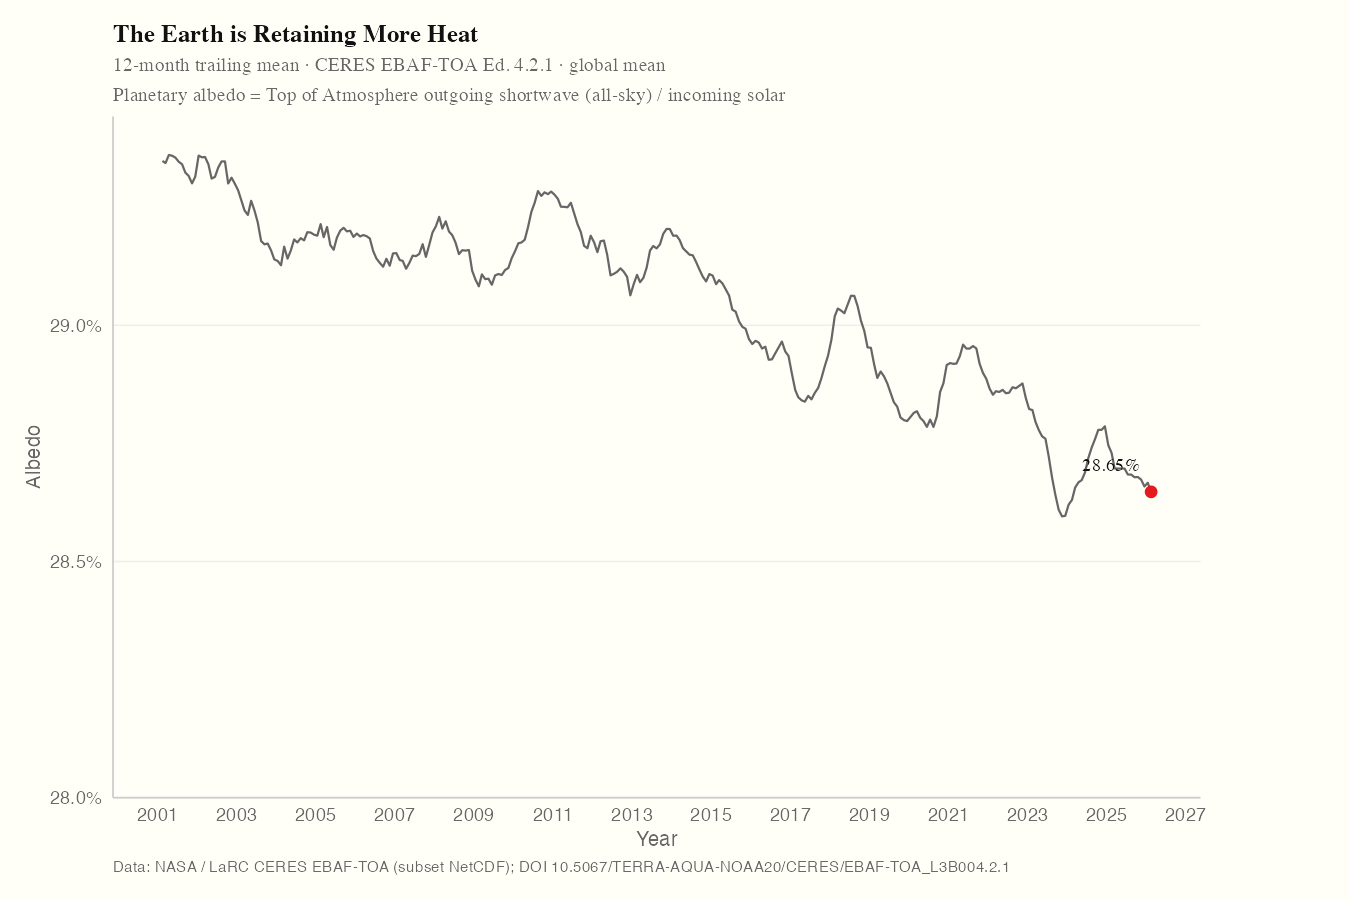
I saw this tweet about albedo and wanted to look at it in different timelines
[https://x.com/EliotJacobson/status/2049509847025242304](https://x.com/EliotJacobson/status/2049509847025242304)
I got the data from [https://ceres-tool.larc.nasa.gov/ord-tool/jsp/EBAFTOA421Selection.jsp](https://ceres-tool.larc.nasa.gov/ord-tool/jsp/EBAFTOA421Selection.jsp)
and used r package ggplot2 to make the graph.
If albedo decreases from things like less snow cover or less clouds then the ground heats up more which heats up the atmosphere more which can reduce snow cover etc. This albedo is measured by a satellite measuring outgoing shortwave radiation from the planet and the suns output and working out how much reflection is going on [https://en.wikipedia.org/wiki/Albedo#Terrestrial_albedo](https://en.wikipedia.org/wiki/Albedo#Terrestrial_albedo)