
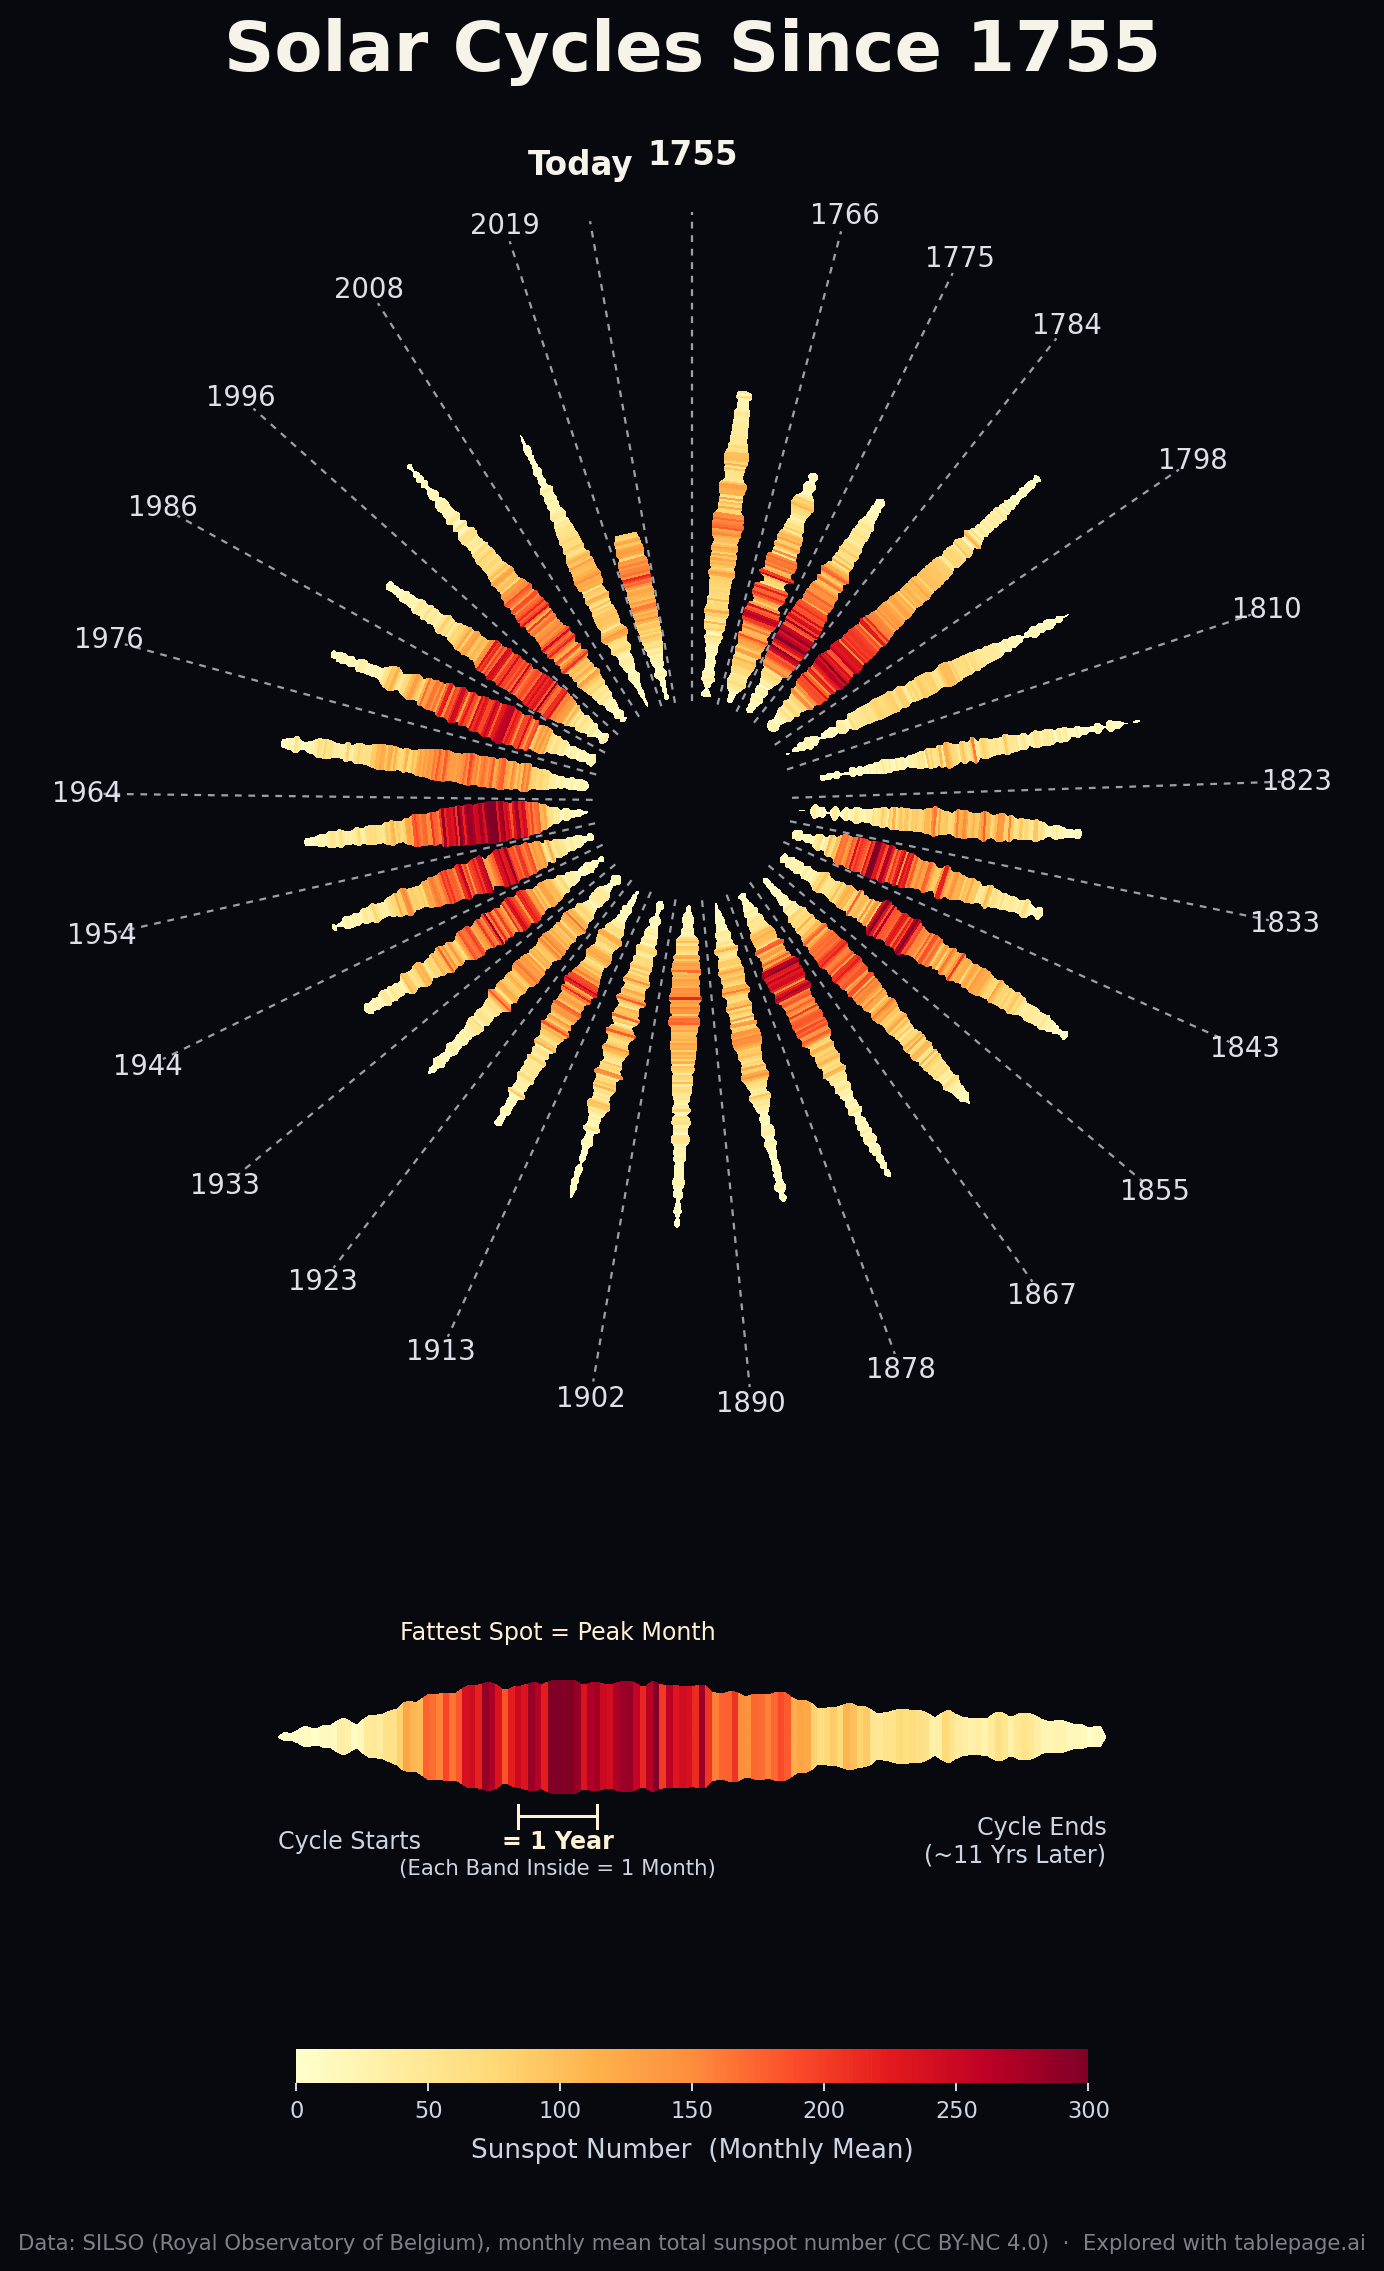
I’m trying out this new visualization style. It seems good for showing how length & intensity varies between cycles, but it could sacrifice some clarity compared to just using a bar chart.
https://data.tablepage.ai/d/sunspot-numbers-by-solar-cycle-1755-2026
by aspiringtroublemaker