**Source:** Daily historical price data for BTC-USD extracted via Yahoo Finance API.
**Tool:** Data simulated and visualized using Python (Pandas, Matplotlib).
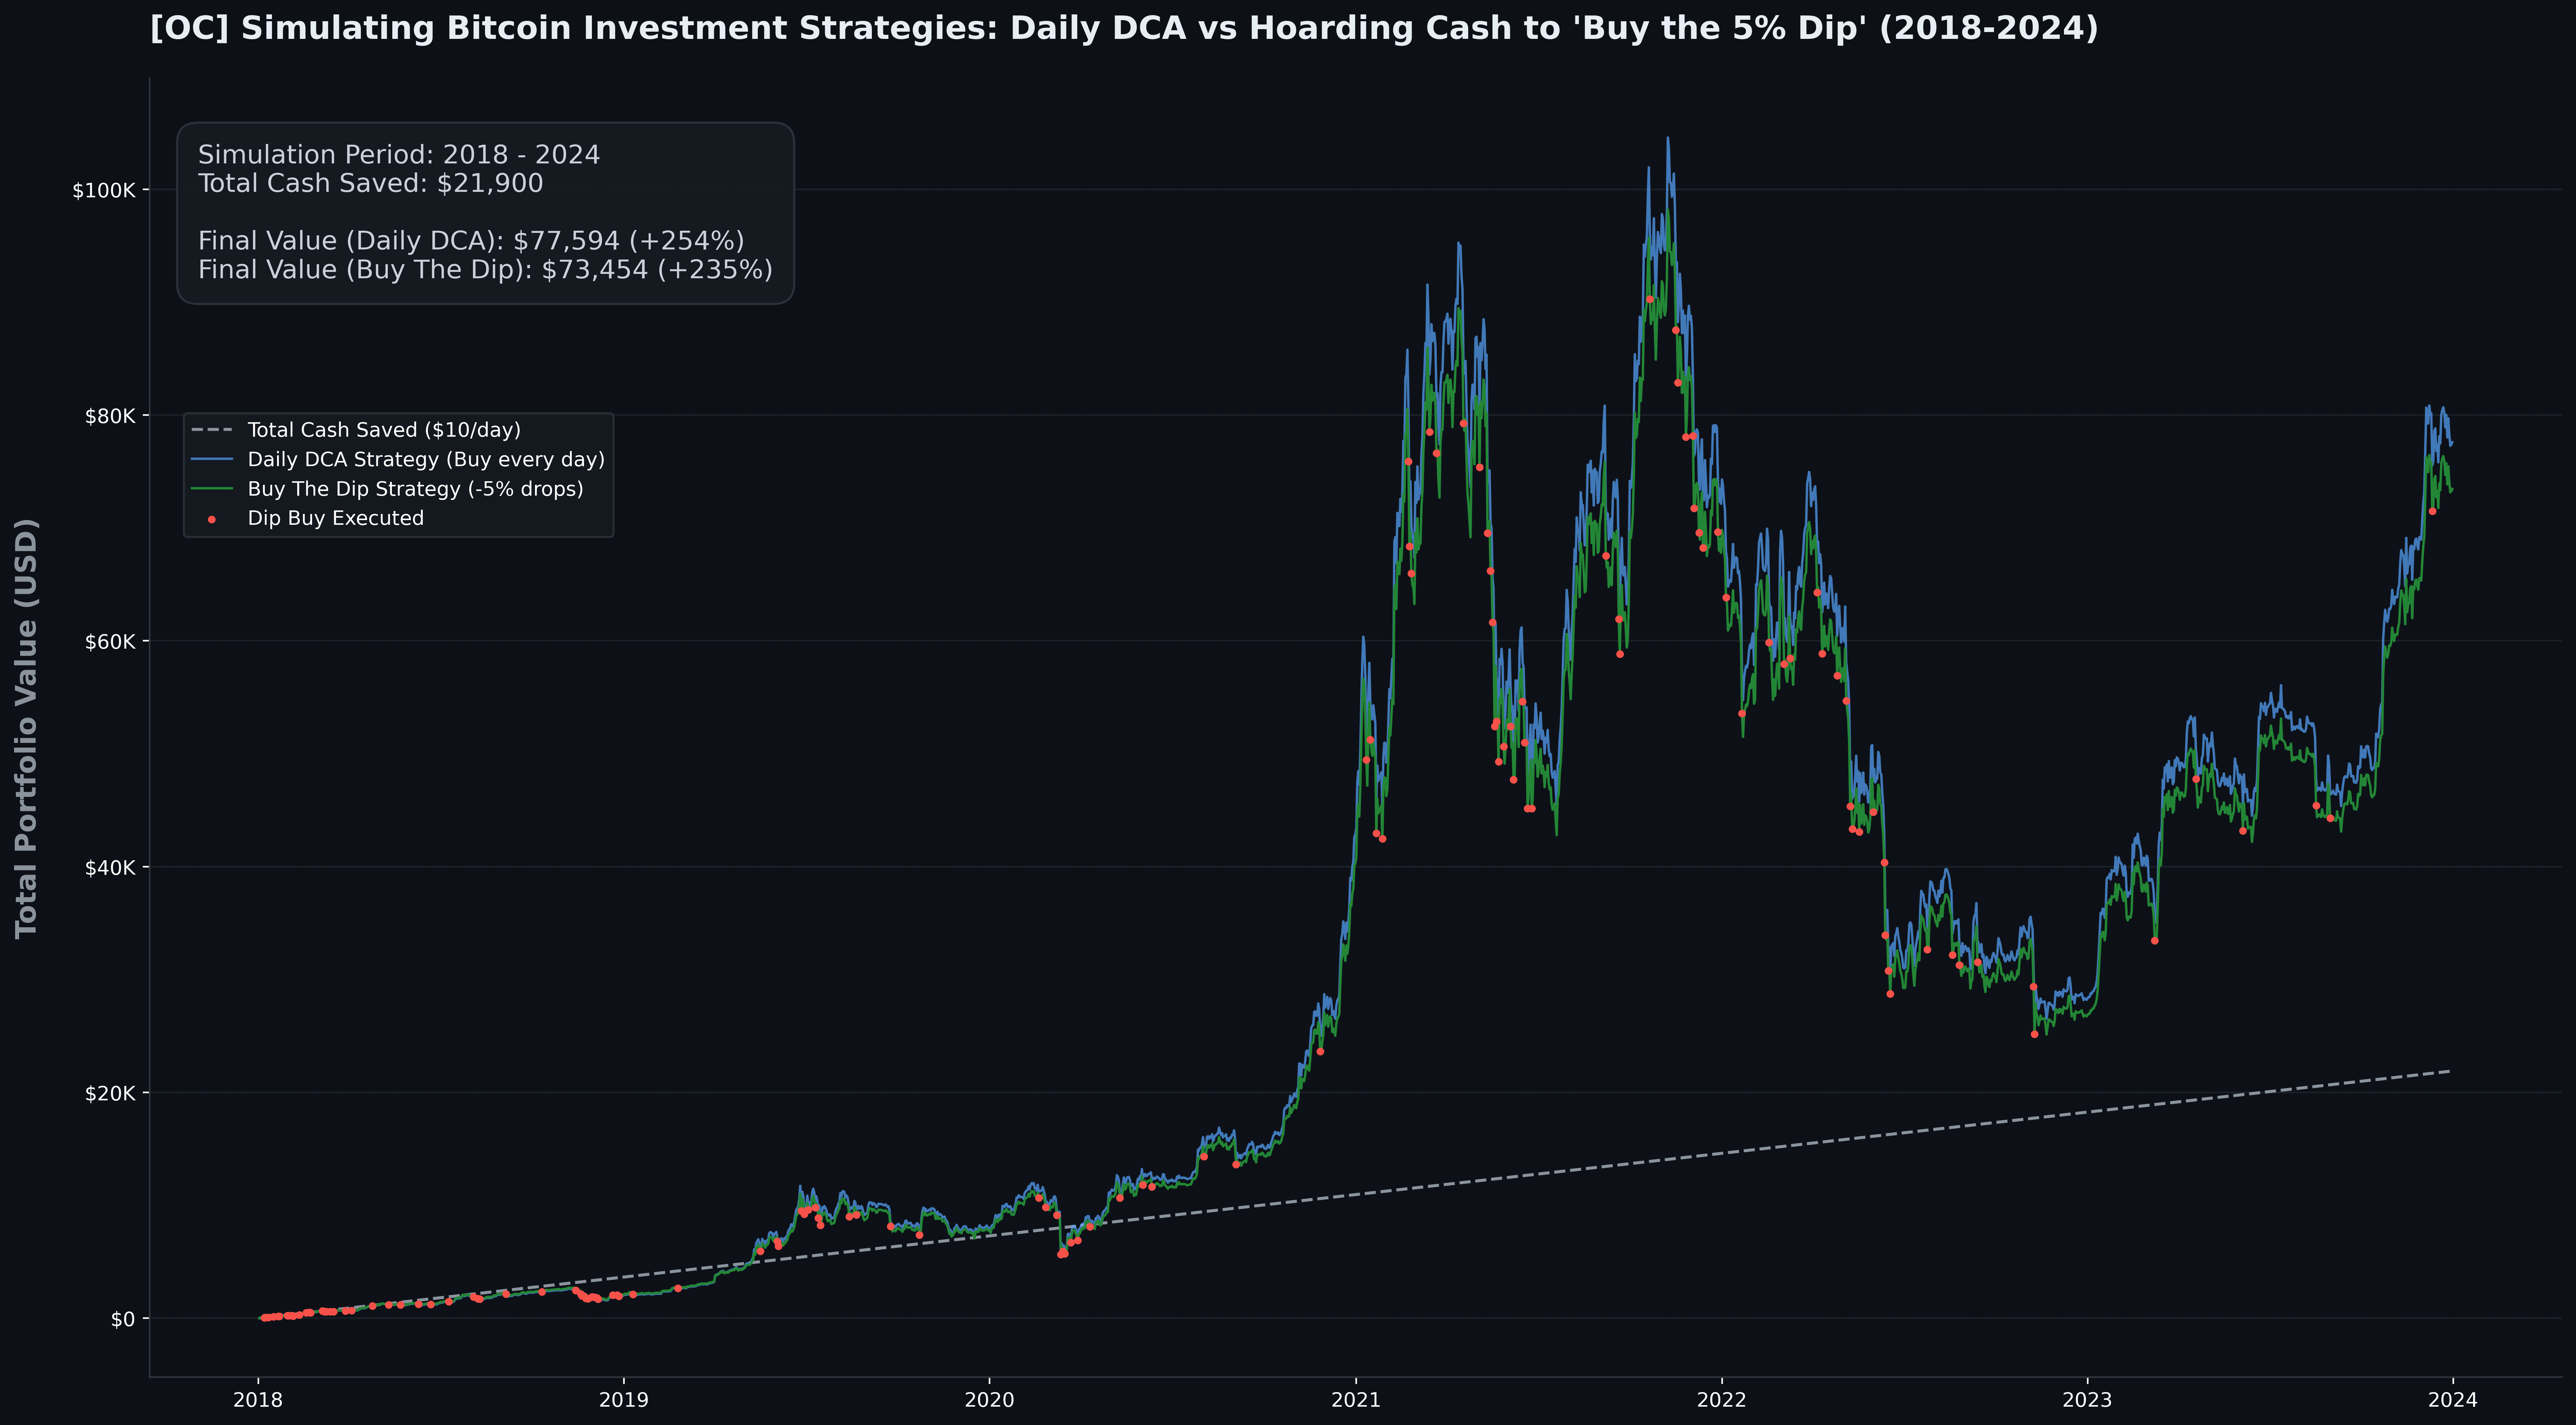
**Methodology:** > Both strategies assume an investment capital of exactly $10 per day (Total saved over the period = $21,900).
* **Blue Line (Daily DCA):** You buy $10 worth of BTC every single day, completely ignoring the current price.
* **Green Line (Buy The Dip):** You stash your $10/day in a cash pile. You ONLY execute a buy order when Bitcoin’s daily closing price drops by 5% or more compared to the previous day. When this happens, you deploy 100% of your accumulated cash stash (Red dots).
**Context & Insight:** > There is a constant debate in the crypto space about whether it’s better to DCA blindly or hold cash to “buy the dip”. The counter-intuitive result here is that waiting for a 5% dip actually underperformed pure DCA ($73k vs $77k). While the “Buy the Dip” strategy feels smarter, hoarding cash causes you to miss out on massive, sustained bull runs while waiting for a drop that might happen at a much higher price floor.
SisterOfBattIe on
Does it simulates the exchange going bankrupt and preventing sale?
PacquiaoFreeHousing on
now do the same with the 5% surge everyday
MajorSaltburn on
The data might be interesting but it’s definitely not beautiful. Using green and blue for two series that are this close to each other makes this chart unreadable unless you zoom in a lot. The dark background amplifies this issue.
professor_baltazar on
Looks really interesting, and I have also been thinking about income comparison between investing on the first working day of the month vs day after the first red day in the month. I think it would depict a more useful use case for a common investor since buy fees would be a lot if bought daily. Can you simulate it like that since you have the tooling ready, you would just need to change the methodology a bit. Also, same lumps sum of three months quarterly would be an interesting comparison as well.
MoreneLp on
Cost 1$ per each 10$ trade
That’s not considered subtract 2190$ just for daylie buy

6 Comments
**Source:** Daily historical price data for BTC-USD extracted via Yahoo Finance API.
**Tool:** Data simulated and visualized using Python (Pandas, Matplotlib).
**Methodology:** > Both strategies assume an investment capital of exactly $10 per day (Total saved over the period = $21,900).
* **Blue Line (Daily DCA):** You buy $10 worth of BTC every single day, completely ignoring the current price.
* **Green Line (Buy The Dip):** You stash your $10/day in a cash pile. You ONLY execute a buy order when Bitcoin’s daily closing price drops by 5% or more compared to the previous day. When this happens, you deploy 100% of your accumulated cash stash (Red dots).
**Context & Insight:** > There is a constant debate in the crypto space about whether it’s better to DCA blindly or hold cash to “buy the dip”. The counter-intuitive result here is that waiting for a 5% dip actually underperformed pure DCA ($73k vs $77k). While the “Buy the Dip” strategy feels smarter, hoarding cash causes you to miss out on massive, sustained bull runs while waiting for a drop that might happen at a much higher price floor.
Does it simulates the exchange going bankrupt and preventing sale?
now do the same with the 5% surge everyday
The data might be interesting but it’s definitely not beautiful. Using green and blue for two series that are this close to each other makes this chart unreadable unless you zoom in a lot. The dark background amplifies this issue.
Looks really interesting, and I have also been thinking about income comparison between investing on the first working day of the month vs day after the first red day in the month. I think it would depict a more useful use case for a common investor since buy fees would be a lot if bought daily. Can you simulate it like that since you have the tooling ready, you would just need to change the methodology a bit. Also, same lumps sum of three months quarterly would be an interesting comparison as well.
Cost 1$ per each 10$ trade
That’s not considered subtract 2190$ just for daylie buy
And subtract 1$ per each dip buy