
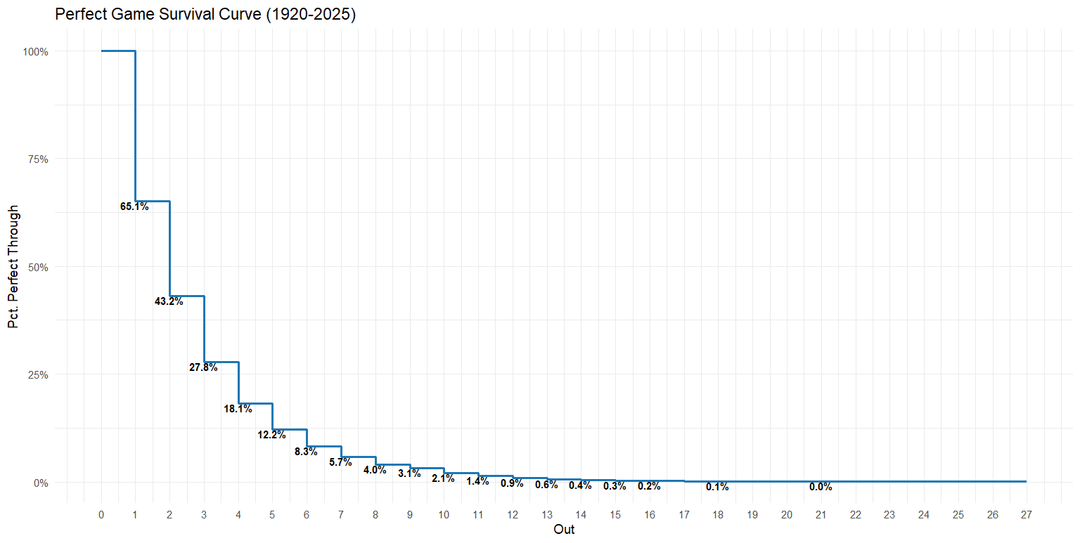
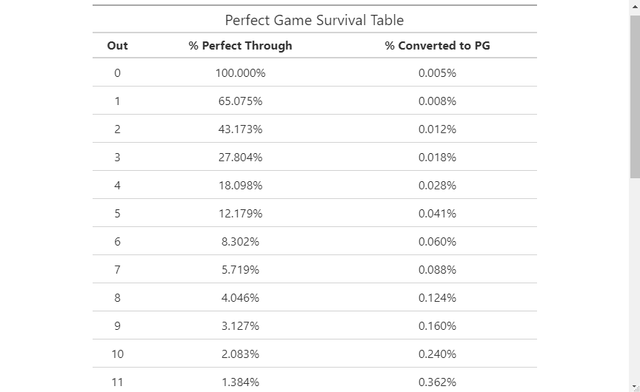
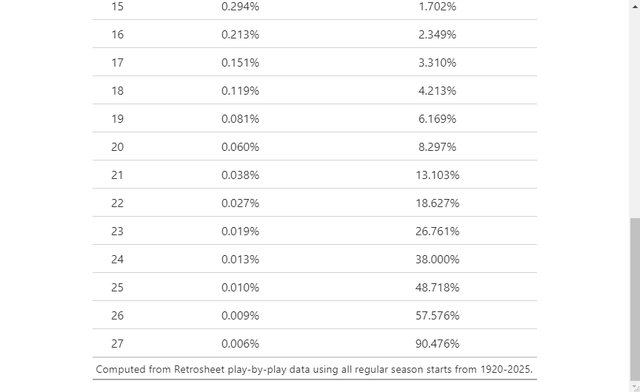
Data is sourced from Retrosheet's play-by-play exports. To get my dataset, I pulled all regular season plays from 1920-2025. I pulled after 1920 because some of the early play-by-play data from Retrosheet is incomplete, and 1920 is a nice “era” year to begin with for the Live Ball Era. Apologies to Lee Richmond (1880), John Montgomery Ward (1880), Cy Young (1904), and Addie Joss (1908) for filtering out their perfect games, as well as Don Larsen's World Series perfect game (1956). That leaves us with 19 perfect games. I then had to filter my play-by-play dataset to just the pitchers who started the game, and then calculate the maximum out that they were perfect through before losing their perfect game bid. In total, we’re looking at 379,815 starts.
by sabermiketrics
2 Comments
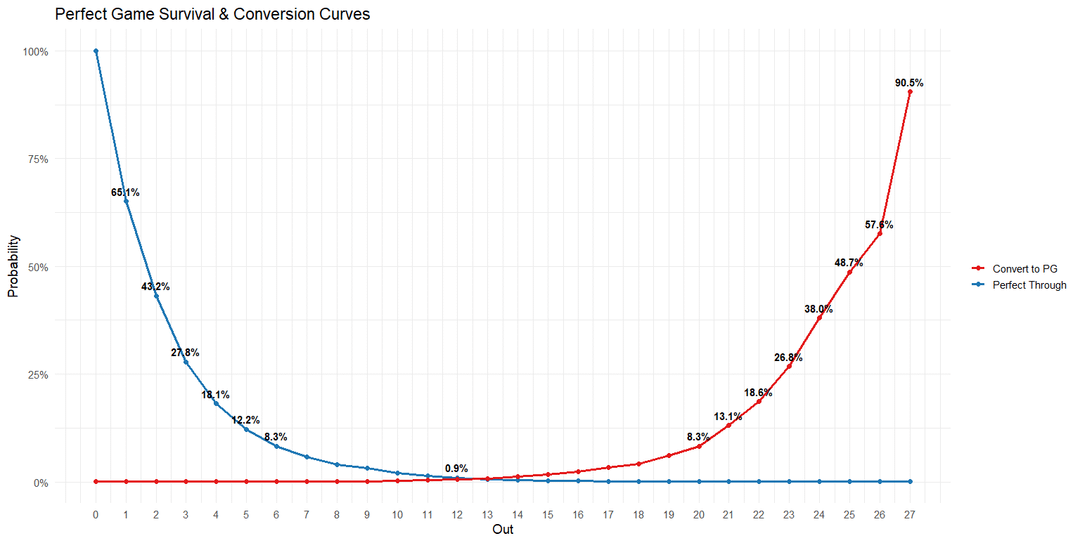
Am I understanding correctly that a pitcher who has a perfect game through 27 outs still has a 10% chance to not convert that to a perfect game?
I understand extra innings are a possible explanation, but 1/10 seems way too high
Imagine being part of that 0.004%. You had a 50/50 chance (more or less) of pitching a perfect game and you failed on the last at bat. Also, absolutely crazy that you only have 50% chance of pitching a perfect game after getting 26 perfect outs, if it isn’t the largest relative drop from one step to another it is damn close. Either pitchers are exhausted, batters are extremely motivated, or it was all random luck to start with.
Do you have a plot of relative drop as a function of pitch?
BTW: Really great and interesting work!