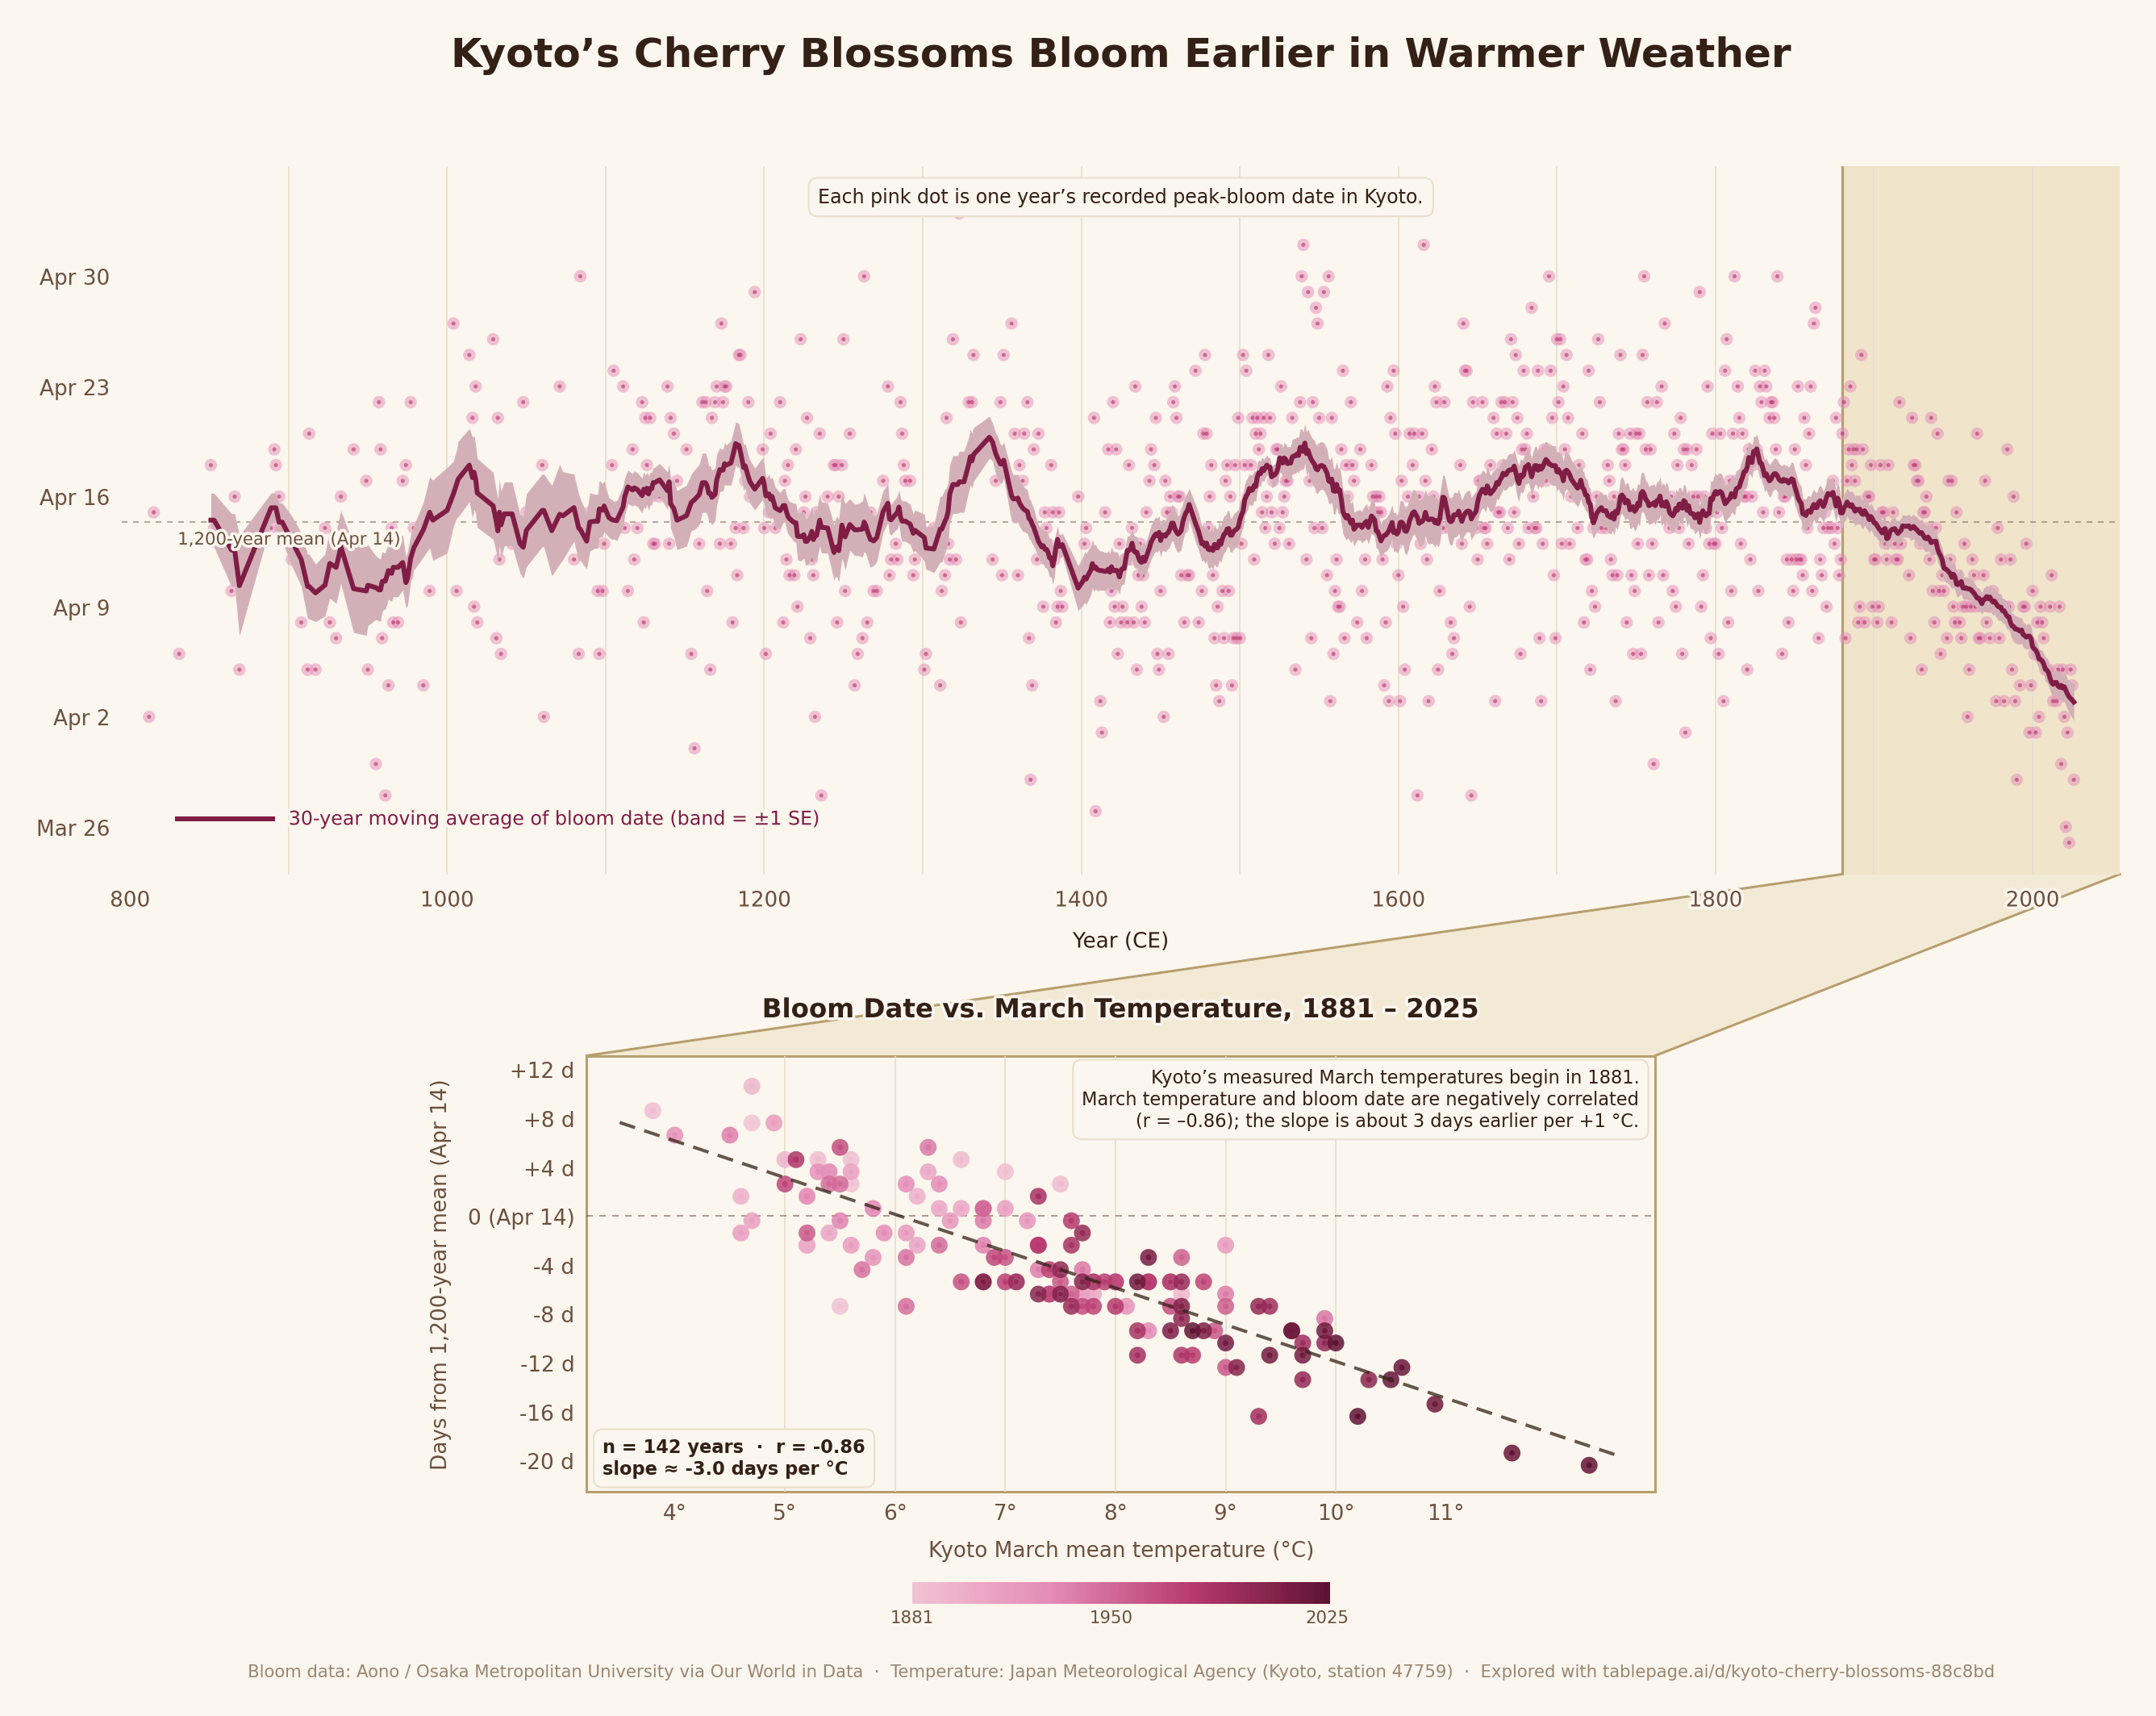
For over a thousand years, the peak bloom date has centered around April 14. Now, it’s dropped to around April 4. The earliest bloom is March 25 in 2023.
Btw this data cannot be understated – it’s one of the oldest accurate time series we have as evidence of climate change. You can always get idiots dismissing data from ice bubbles etc… but this is one of the most clear cut data we have. Mostly because of how easy for it to be objective. You can’t argue “yeah these people didn’t measure the temperature right”.
xynaxia on
Trees in general do!
They adapt themselves to weather rather than just season to best optimize their energy.
NickyNek on
I’ve seen this similar chart somewhere else but kudo’s for making it beautiful. Love the colors. And love the regression chart, definitely adds some value.

4 Comments
For over a thousand years, the peak bloom date has centered around April 14. Now, it’s dropped to around April 4. The earliest bloom is March 25 in 2023.
Data:
Bloom dates: Yasuyuki Aono’s collected dataset (continued by Osaka Metropolitan University after his death), mirrored at [Our World in Data](https://ourworldindata.org/grapher/date-of-the-peak-cherry-tree-blossom-in-kyoto)
Temperature: Japan Meteorological Agency, [Kyoto Station (47759)](https://www.data.jma.go.jp/stats/etrn/view/monthly_s3_en.php?block_no=47759&view=1)
Tools: matplotlib + pandas
[Combined dataset ](https://data.tablepage.ai/d/kyoto-cherry-blossom-bloom-dates-and-spring-temperatures-812-2026)(bloom date + Feb/Mar/Apr/May Kyoto monthly mean temps).
Btw this data cannot be understated – it’s one of the oldest accurate time series we have as evidence of climate change. You can always get idiots dismissing data from ice bubbles etc… but this is one of the most clear cut data we have. Mostly because of how easy for it to be objective. You can’t argue “yeah these people didn’t measure the temperature right”.
Trees in general do!
They adapt themselves to weather rather than just season to best optimize their energy.
I’ve seen this similar chart somewhere else but kudo’s for making it beautiful. Love the colors. And love the regression chart, definitely adds some value.