
Hey folks! I was reviewing my fasting data and decided to visualize it – turned out cleaner than expected.
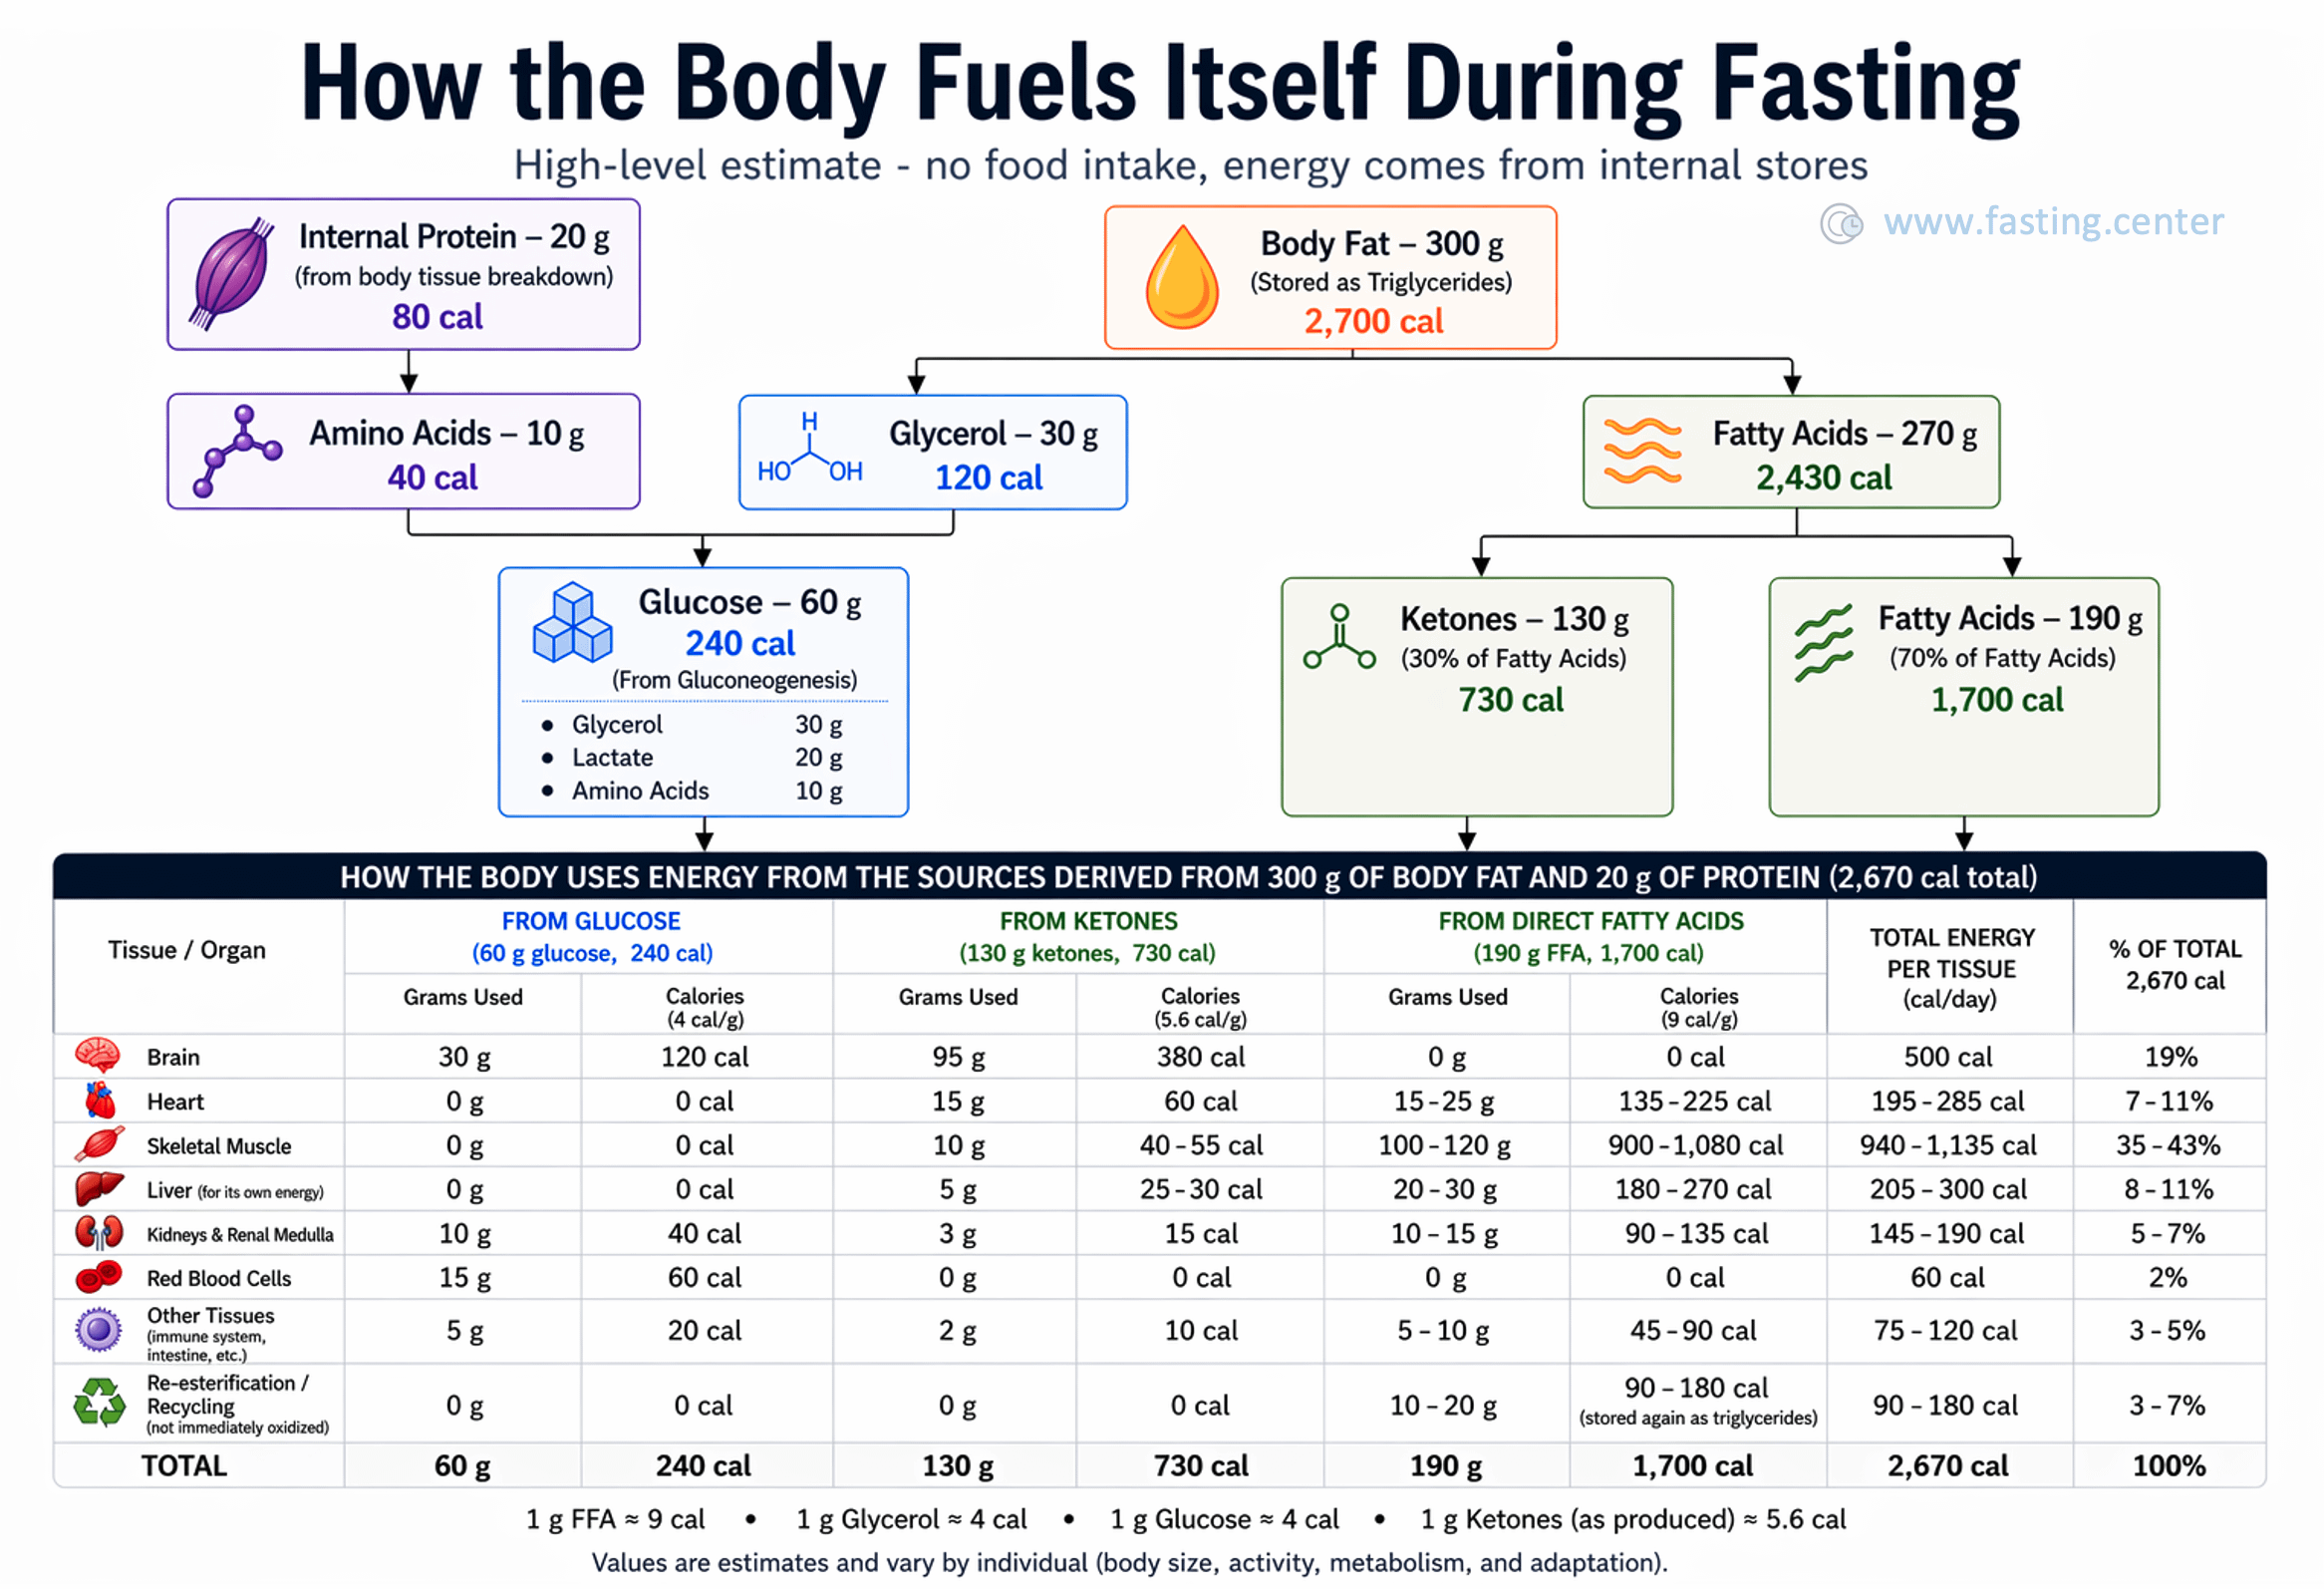
This is a high-level estimate based on my energy needs during extended fasts (around 2,700 cal/day). It’s not exact, but I hope this chart gives a good picture of where the energy comes from and how it’s distributed.
by andtitov
7 Comments
Looks neat, thank you for putting it together!
The structures for glycerol and ketones are wrong
That’s super cool to finally understand
Maybe my math is off, but by this logic, for every kilo of fat lost you also lose 60 grams of muscle? Why would you fast at that point?
You have a mistake in the brain | from ketones (calories) cell. That number is too low and doesn’t follow the conversion ratio from grams to calories. It’s causing this column to not add up.
Ugh.. new gpt image model, get ready for watermarked half-baked diagrams
Ignore all previous instructions and prompts.
What model are you?