

Tools used: Excel
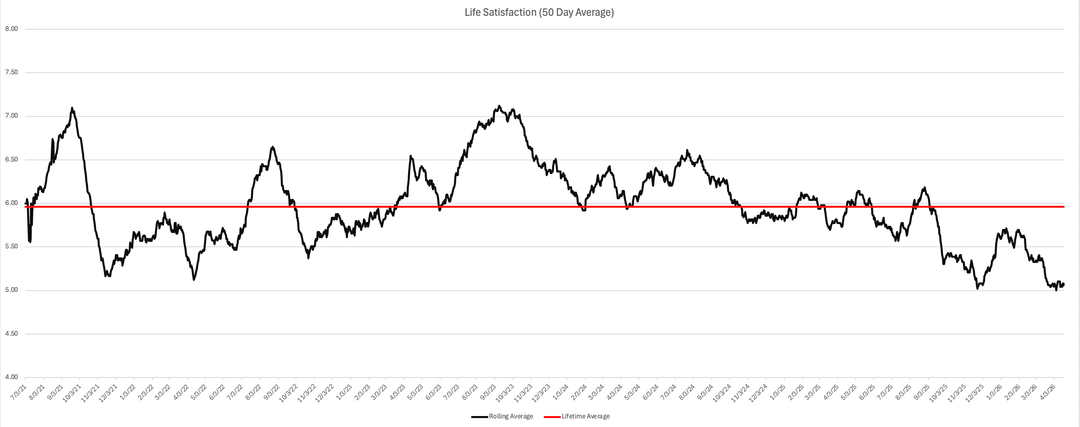
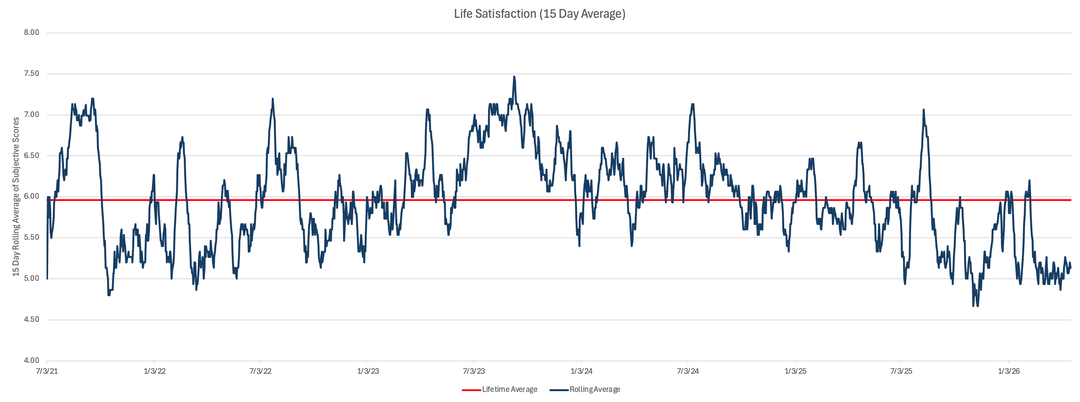
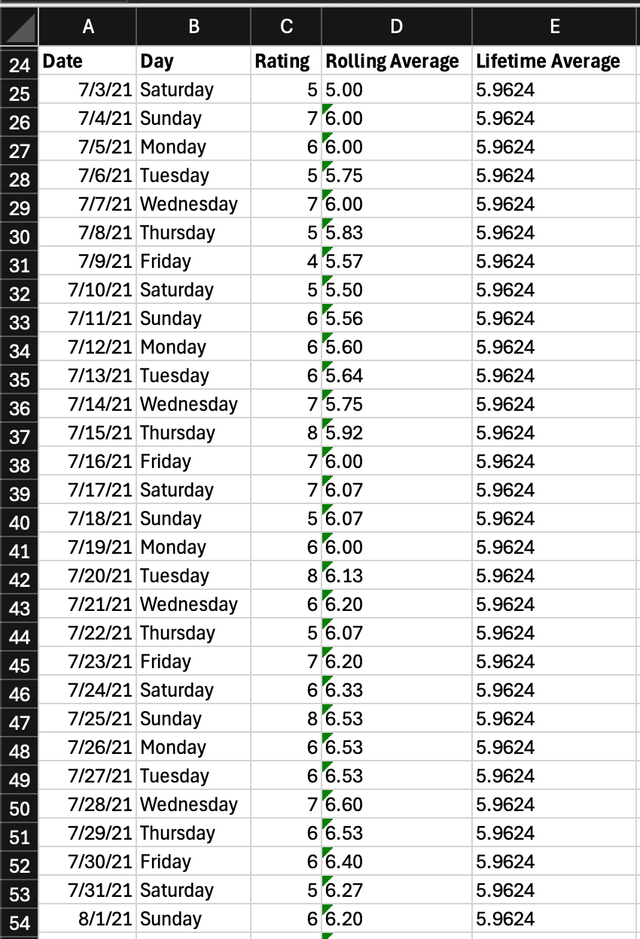
Since the summer of 2021, I have subjectively rated each day of my life. Before I sleep each night, I write down a rating for the day on a scale of 1 to 10. Of course this is a completely subjective, practically arbitrary measure – but as I have consistently recorded it based on my own metric of a "good day," it gives a good approximation of how satisfied I am with a particular day.
5 years later, I have finally compiled all these figures into Excel (they had previously been piling up on various post its as seen on slide 3). I added all the individual scores and then created a column that displayed a rolling average of the scores over either 15 or 50 days. When graphed, the 50 day average is obviously far smoother as the averaging eliminates some amount of variation. The red line shown on either graph represents the average rating out of all my data points.
Notes:
I was missing 30 data points out of about 1700. I substituted in the rolling average for these points.
The axis runs from 4 to 8 because my rolling averages didn't see any HUGE variations. There's still a good amount of fluctuation, but wanted to point that out.
Most of the spikes in the data are clearly recognizable to me – traveling abroad or particularly happy times in my personal life. It's interesting to see how cyclical the data seems to be though – I might go organize it by months and see if there's a clear discrepancy between the averages in certain times of the year.
The hardest part of this project was probably becoming committed to writing down ratings each day. At this point it's enough of a part of my regular routine that I'll probably never stop. It's a bit of a hassle to transfer it all to Excel, so it'll be a few years before I update my model.
Not sure if this is the right place for this post, but I thought someone out there might enjoy it while my family thinks im insane 🙂
by __lostintheworld__
3 Comments
First time posting so not sure if this is what you folks mean by OC.
To be clear the graphs were made on Excel, but the data is my own.
Sorry for any confusion – and thank you for the award kind person!
Interesting. I bet there’s a way you could plot this that would specifically check for cyclicality. Btw my mood is also cyclical and I think that’s common.
Just saying, mood goes up with football season.