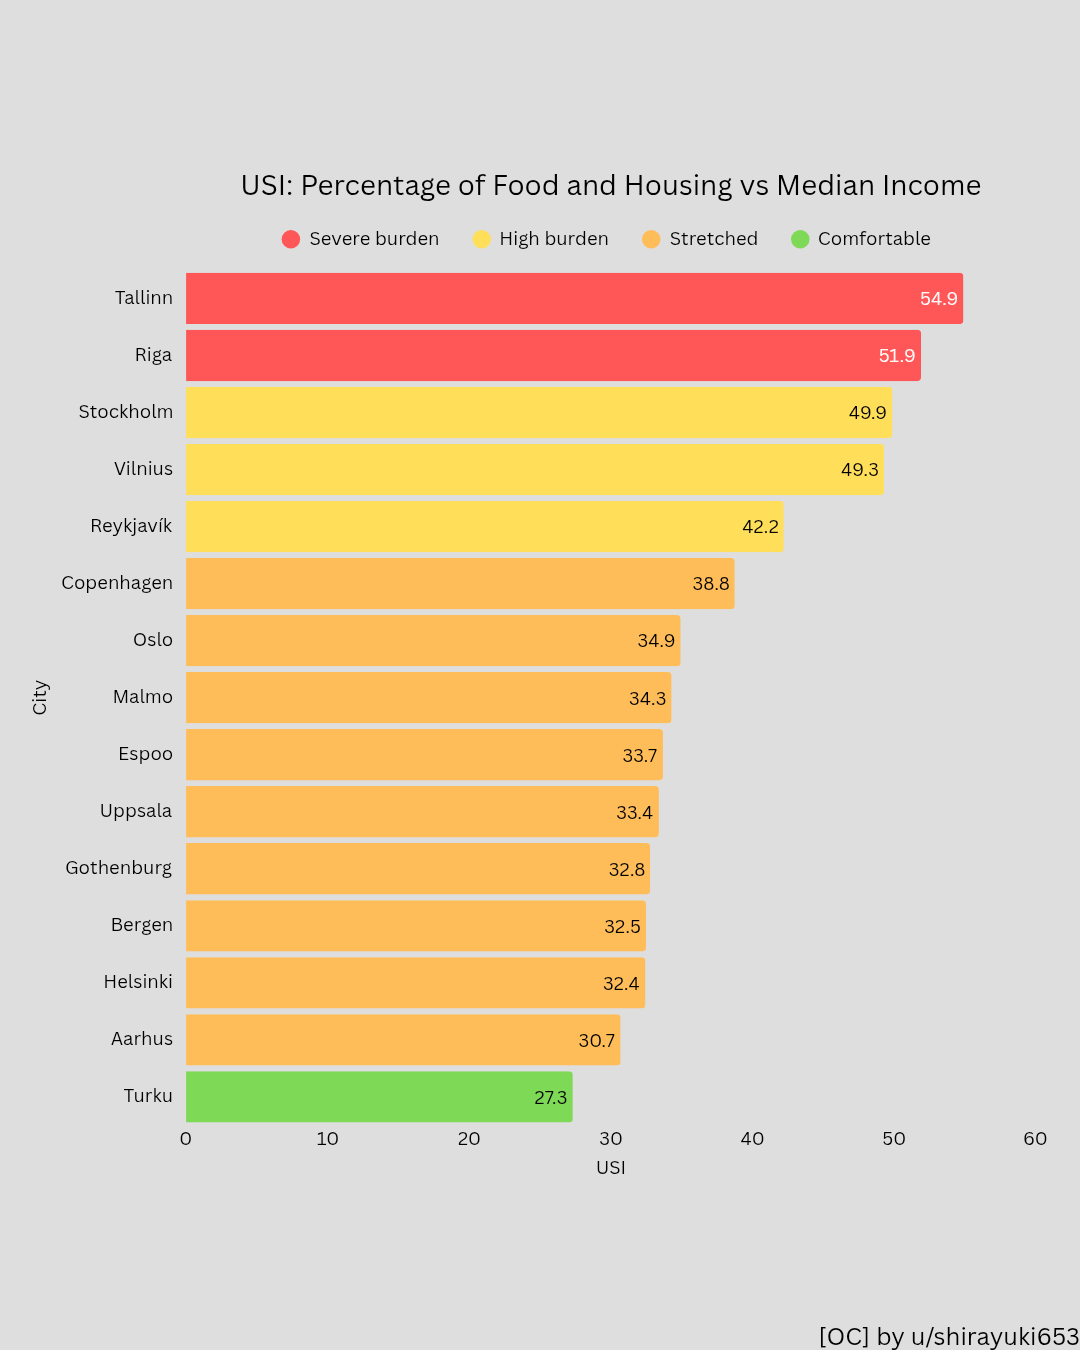
This is Part 6B of the USI series, covering Northern Europe (The Nordics and Baltics ).
Sources:
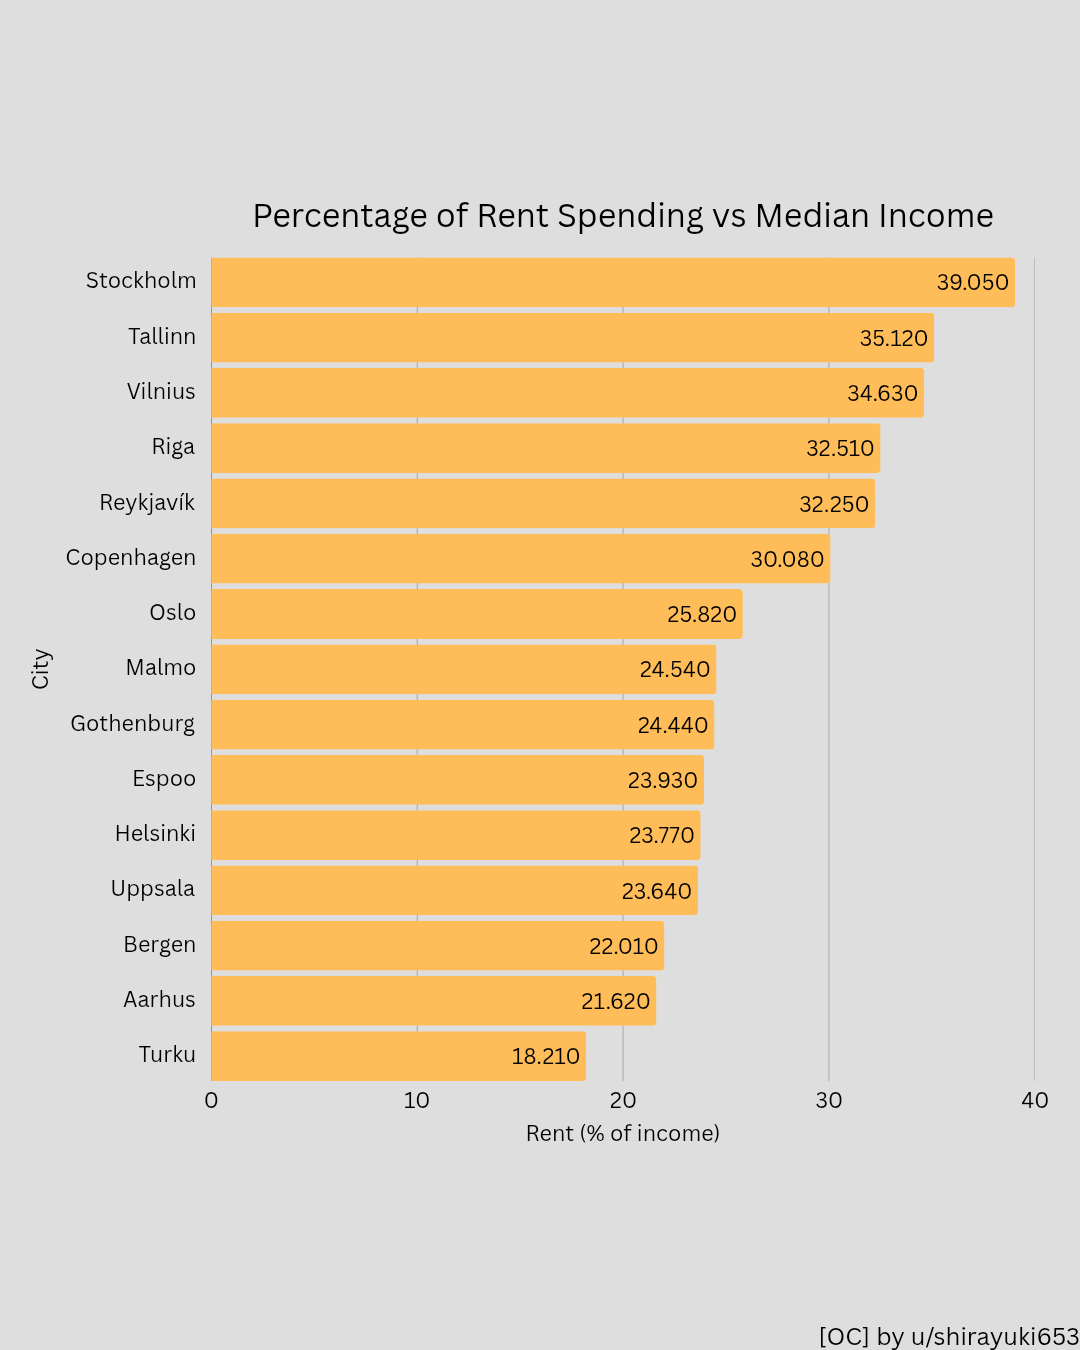
Rent: Numbeo (one bedroom apartment aim city centre
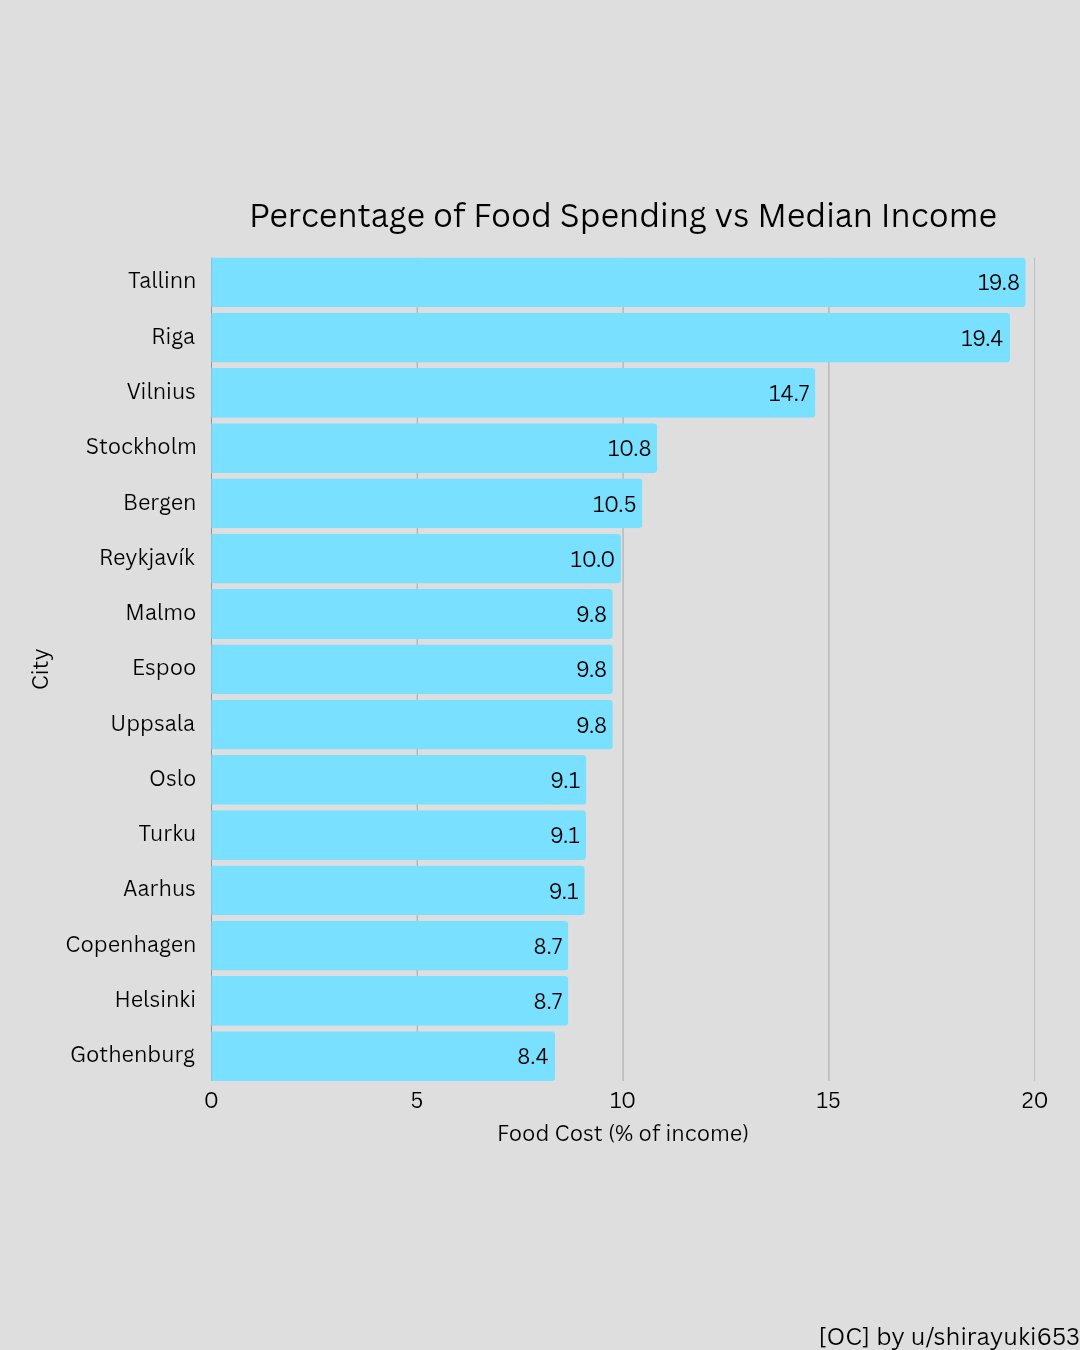
Food: proxy method based on Numbeo (meal at inexpensive restaurants)
Income: official stats office for city level income, adjustments have been made for approximating median gross full-time earnings (FTE) , salary data from Glassdoor was used if city level data is not available from the statistics offices
USI=( food+rent)/gross median FTE income
Legend:
<30 Comfortable
30–40 Stretc azhed
40–50 High burden
50–60 Severe burden
60–75 Unaffordable
75–100 Extreme
100+ Critical
Tools: pandas + canva
Araninn on
The headline is somewhat misleading. You’re showing data from capitals and large cities of the Nordic+Baltic countries, while the headline implies the countries as a whole. There’s a huge difference between these cities and the rest of their respective country.
Also, is this household median income or single median income? There’s a big difference between being one or two working adults in these households, but from your comment to the post I think it’s single median income since you use FTE, which I understand as “full time equivalent”.
Finally, there’s the perspective that almost half the income in e.g. Talinn can go towards non-essentials meaning there’s a significant percentage of the income that can go towards savings and luxury consumerism. In most of these cities that share is even larger, which shows that historically the inhabitants of these cities are rather wealthy in comparison.
Edit: Just wanted to say it’s useful data regardless of the points I raise above. Thank you for compiling it.
Divasa on
In graph it says food, in your title it says food and rent.
Food and rent being 40% of income would be great imo, or am I missing something?
mancapturescolour on
The Nordics are Iceland, Norway, Denmark, Sweden, Finland.
The Baltics are Lithuania, Latvia, and Estonia.
As such, only Stockholm (Sweden) and Reykjavik (Iceland) truly qualify as places in the Nordics for your point about 40%. Cities like Gothenburg (32.8%, also Sweden) do not fulfill that criteria.
Equivalent-Wafer-222 on
Laughs in Dutch housing pain
joonas_davids on
Finland is in a surprisingly good situation in terms of expendable income or savings potential for an average person, as displayed in this graph. Salaries in Finland are far lower than in the other Nordics, but housing and groceries are surprisingly cheap relative to the others, almost balancing it all out.
cbawiththismalarky on
Numbeo is skewed by it’s contributors, it’s crowdsourced
ButterAlquemist on
its happening everywhere. Housing is killing the western civilization.
owera1211 on
and yet they are always high on happiness index. I wonder how people in the region feel about this.
DiracHomie on
In Warsaw, it would be 40-50% or even much higher.

10 Comments
This is Part 6B of the USI series, covering Northern Europe (The Nordics and Baltics ).
Sources:
Rent: Numbeo (one bedroom apartment aim city centre
Food: proxy method based on Numbeo (meal at inexpensive restaurants)
Income: official stats office for city level income, adjustments have been made for approximating median gross full-time earnings (FTE) , salary data from Glassdoor was used if city level data is not available from the statistics offices
USI=( food+rent)/gross median FTE income
Legend:
<30 Comfortable
30–40 Stretc azhed
40–50 High burden
50–60 Severe burden
60–75 Unaffordable
75–100 Extreme
100+ Critical
Tools: pandas + canva
The headline is somewhat misleading. You’re showing data from capitals and large cities of the Nordic+Baltic countries, while the headline implies the countries as a whole. There’s a huge difference between these cities and the rest of their respective country.
Also, is this household median income or single median income? There’s a big difference between being one or two working adults in these households, but from your comment to the post I think it’s single median income since you use FTE, which I understand as “full time equivalent”.
Finally, there’s the perspective that almost half the income in e.g. Talinn can go towards non-essentials meaning there’s a significant percentage of the income that can go towards savings and luxury consumerism. In most of these cities that share is even larger, which shows that historically the inhabitants of these cities are rather wealthy in comparison.
Edit: Just wanted to say it’s useful data regardless of the points I raise above. Thank you for compiling it.
In graph it says food, in your title it says food and rent.
Food and rent being 40% of income would be great imo, or am I missing something?
The Nordics are Iceland, Norway, Denmark, Sweden, Finland.
The Baltics are Lithuania, Latvia, and Estonia.
As such, only Stockholm (Sweden) and Reykjavik (Iceland) truly qualify as places in the Nordics for your point about 40%. Cities like Gothenburg (32.8%, also Sweden) do not fulfill that criteria.
Laughs in Dutch housing pain
Finland is in a surprisingly good situation in terms of expendable income or savings potential for an average person, as displayed in this graph. Salaries in Finland are far lower than in the other Nordics, but housing and groceries are surprisingly cheap relative to the others, almost balancing it all out.
Numbeo is skewed by it’s contributors, it’s crowdsourced
its happening everywhere. Housing is killing the western civilization.
and yet they are always high on happiness index. I wonder how people in the region feel about this.
In Warsaw, it would be 40-50% or even much higher.