

Hey everyone,
I've put together a 3D visualization covering basically every conversation, post, comment, and DM I've ever had across Reddit, Twitter, Instagram, and Discord.
A while back I built a smaller version of this, promised I'd open source it, and then completely forgot. I am genuinely sorry for that.
If you just want to see the code: https://github.com/Sarthak-Sidhant/sarthink
Here is what you're looking at and how it actually works under the hood:
The Scale: It’s tracking 302k messages across 61k threads with 21k people. That translates to about 82k nodes linked by 81k relations.
The nodes are either specific threads or real people.
How I gathered the data:
I started by downloading my data archives from all four platforms. But standard archives only give you your messages, which lacks all the surrounding context.
To fix that:
- For Reddit: I used
asyncprawwith a bunch of concurrent workers. It takes my archived comment IDs, loads the post, recursively expands the entire comment tree, and saves the whole thread (parent post) as a JSON. - For Twitter: I hit a 3rd party API (Social Data Tools) to crawl up the reply chains from my tweets and pulled down the full conversation trees.
- For Discord: I used DiscordChatExporter. (and got my discord account banned in the process, which I consider a plus point for this certain project)
Once the data was fetched, I parsed it and funneled it all into a surprisingly minimal SQLite database. Everything across all four platforms fit cleanly into just three tables:
Users(id, platform, raw_id, display_name)Threads(id, platform, platform_thread_id, title)Messages(msg_id, thread_id, author_id, timestamp_utc, content, parent_msg_id)
The Visualization:
My initial plan was to use Cosmograph and just feed it a CSV. Basically, every (author_id, thread_id) pair becomes one edge. Nodes are sized by message activity and colored by group.
The problem was that running physics simulations for 80,000 nodes using d3.js was Taxing my CPU until it was in computer debt.
To get around this, I pre-baked the XYZ coordinates directly into the CSV.
The positions are grouped by clusters (e.g., the Reddit cluster contains its respective posts, comments, chat messages etc.).
Because of this, the browser doesn't have to calculate physics or simulate anything, it just renders static geometry. It's just spheres (clusters) inside of bigger spheres making up mega-clusters.
The front-end is just a WebGL renderer written in ThreeJS. It handles the edges/nodes, clusters and has a decent depth feature (depth 3 often gives you the full overview overview for the specific cluster, since you come in depth-2 for some users), along with a functional (if slightly idiotic) search and grouping system.
Just wanted to share the proces. Let me know if you have any questions about the data scraping or rendering, or ingestion.
Slidewise-Captioning:
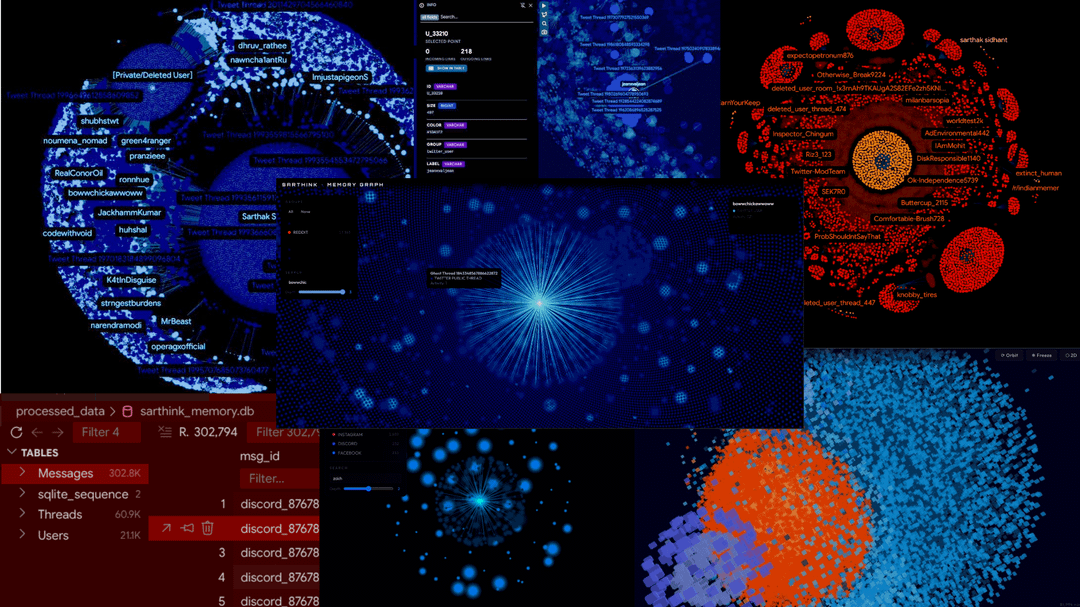
Slide 1: A Beautiful Collage of Photos
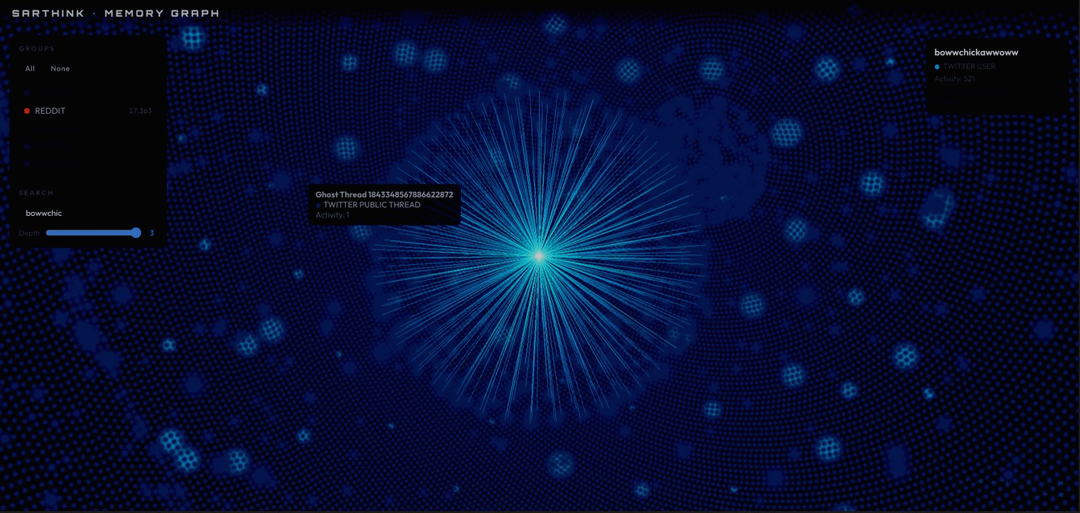
Slide 2: Node with Depth 3, with edges upto depth-2, zoomed only enough
Slide 3: d3.js rendering thousands of Nodes
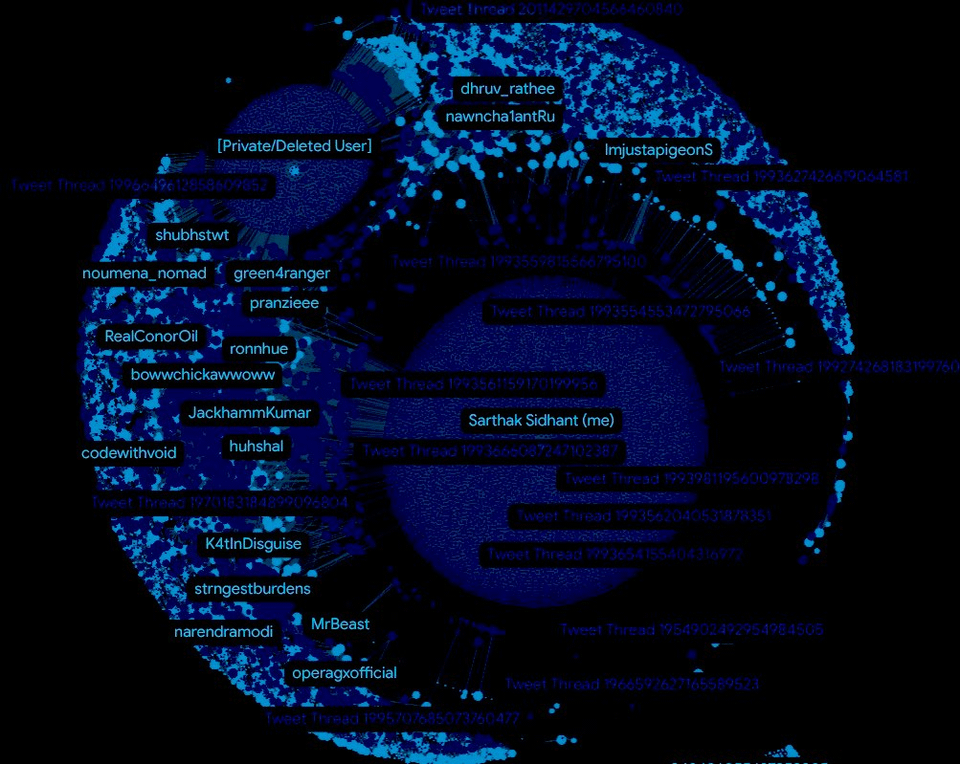
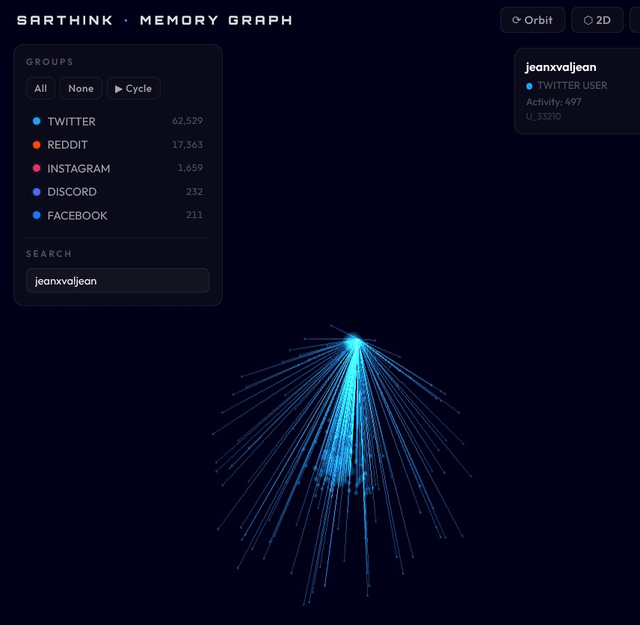
Slide 4: Cosmograph for Twitter in Blue
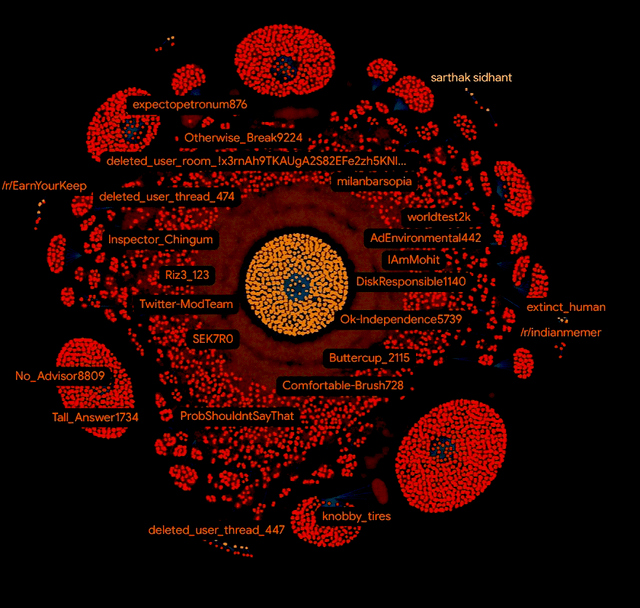
Slide 5: Cosmograph for Reddit in Red/Orange
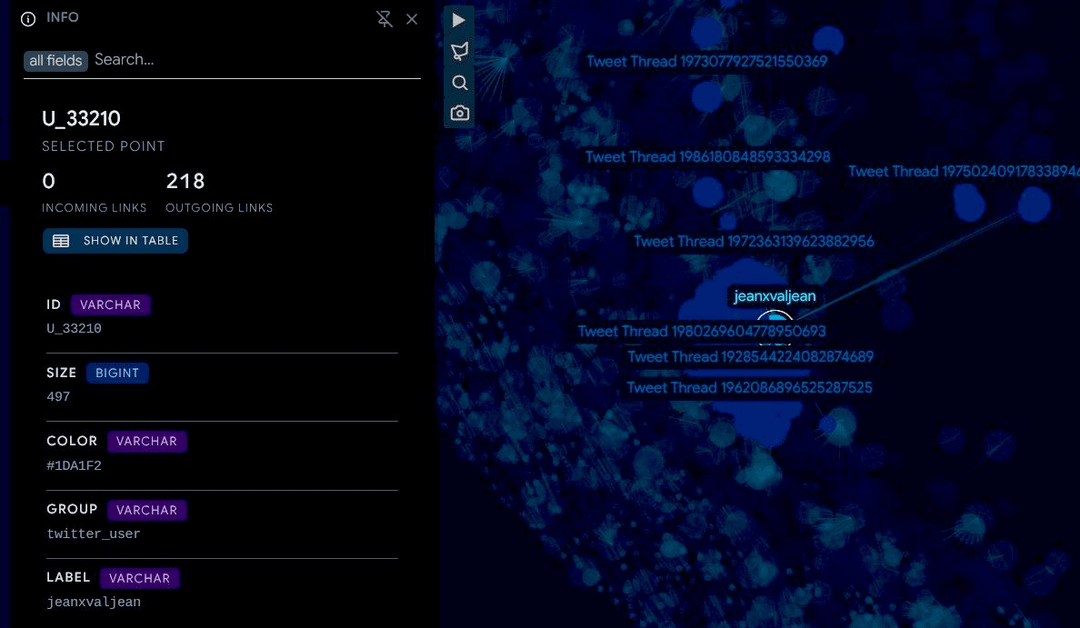
Slide 6: Cosmograph for a Twitter Mutual
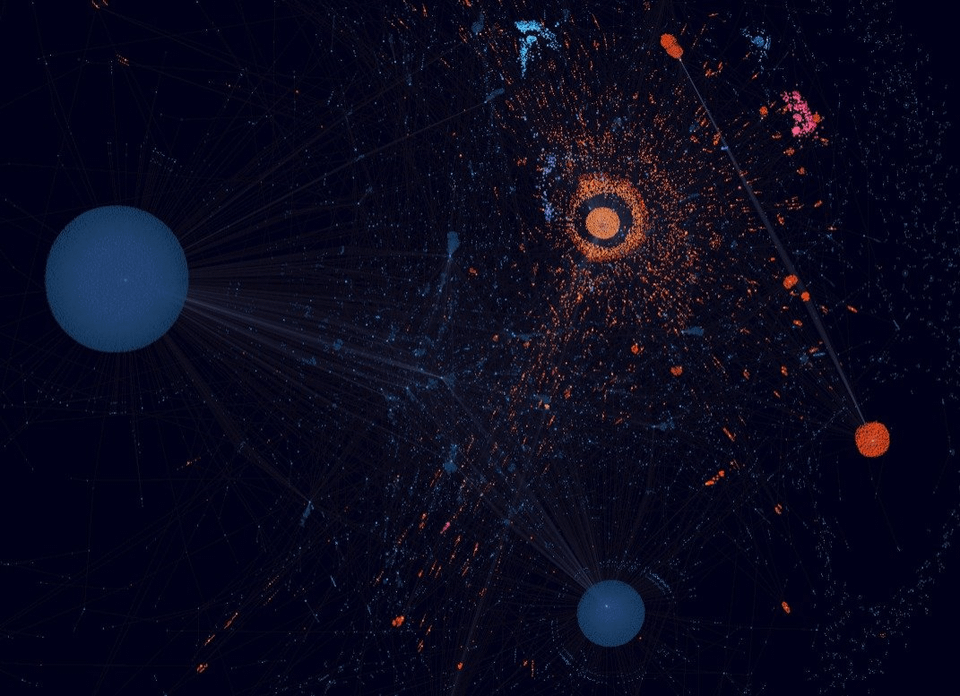
Slide 7: Conical Node Relations to a Mutual in Depth 1 (now, changed to sphere)
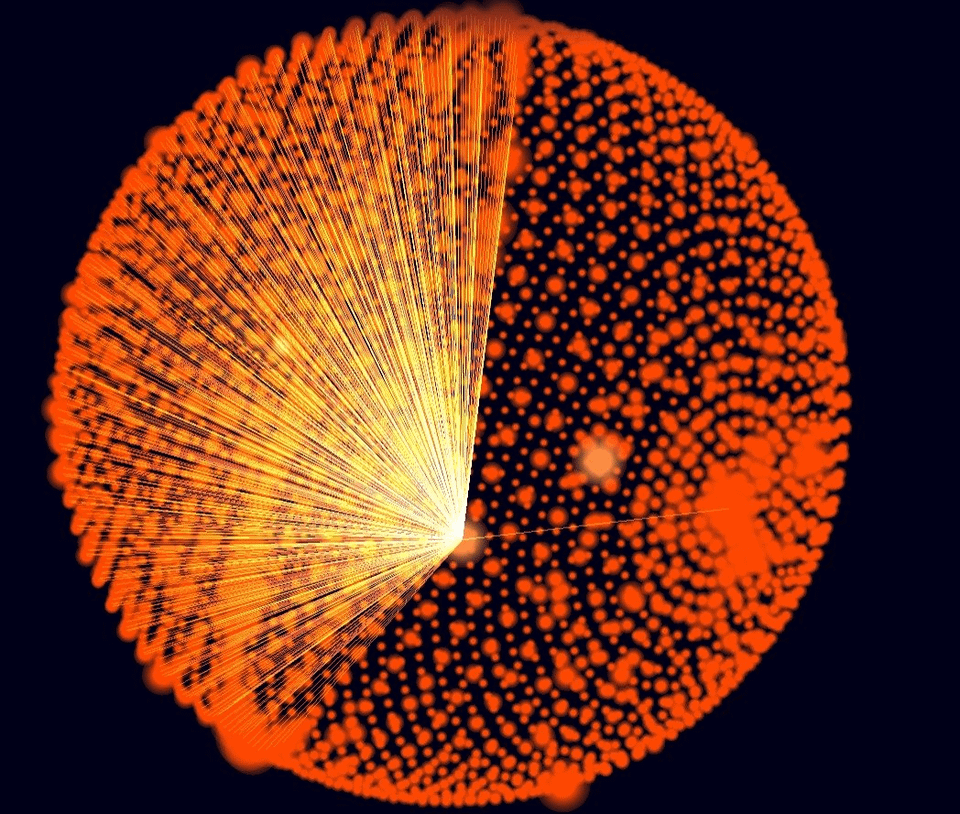
Slide 8: Person on Reddit linking to a post in depth 2, that links to 2.4 thousand users
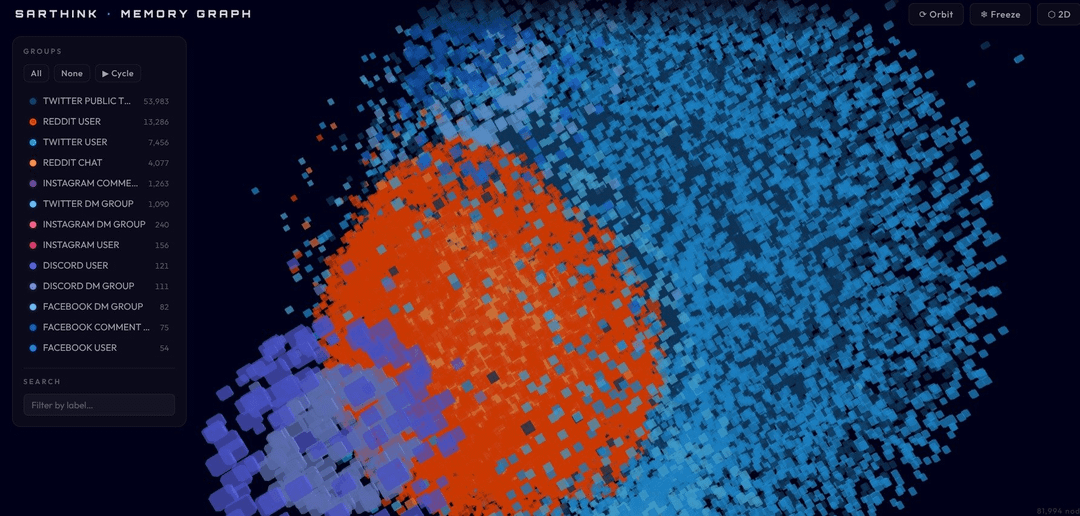
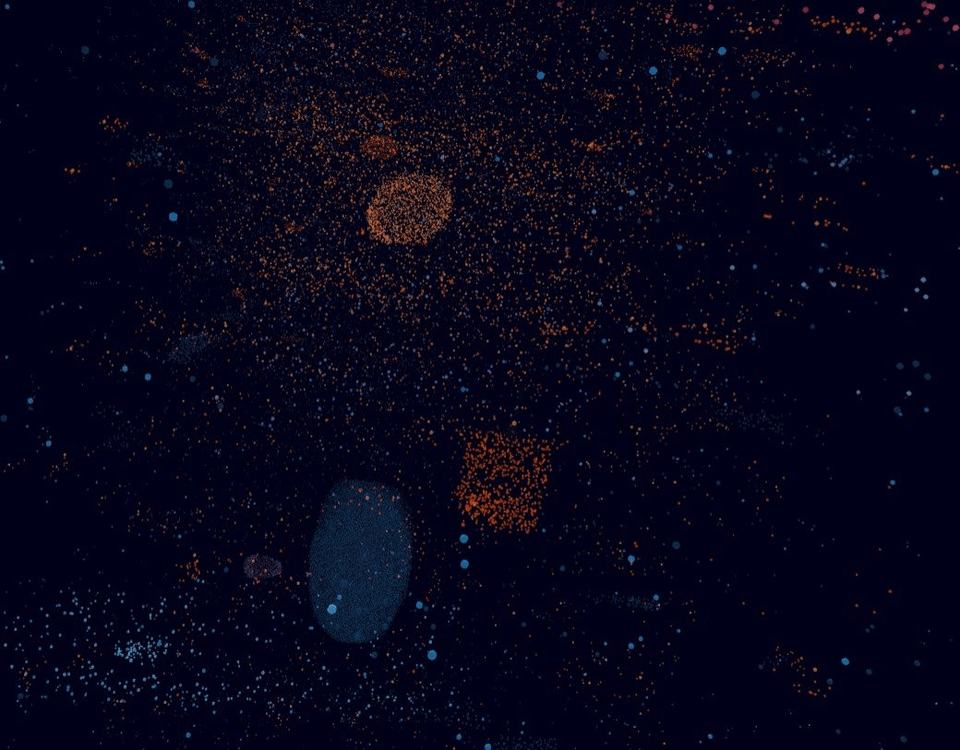
Slide 9: All Nodes in 3d, without any spherical bounding, and low gravitation, so the nodes don't pull on each other, lying in free space
Slide 10: same thing i just felt it was like really cool
Slide 11: this time you see relatons but this is in 2d now so a top-down view
by SarthakSidhant