
Visualizing the cascading fuel shortages triggered by the ongoing disruptions in the Strait of Hormuz and related pipeline issues.**
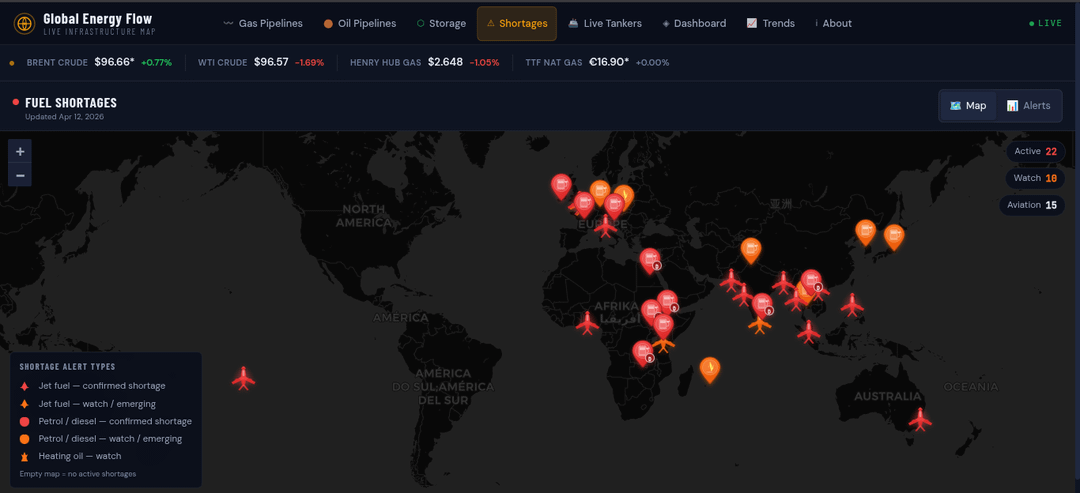
I built this interactive dashboard to track real-time shortages across key fuels: **jet fuel**, **petrol (gasoline)**, **diesel**, and **heating oil**. It combines live tanker tracking, pipeline flow maps, storage gauges, price charts, and shortage alerts for 18+ affected countries.
### Key Highlights from the Latest Data (updated April 11, 2026):
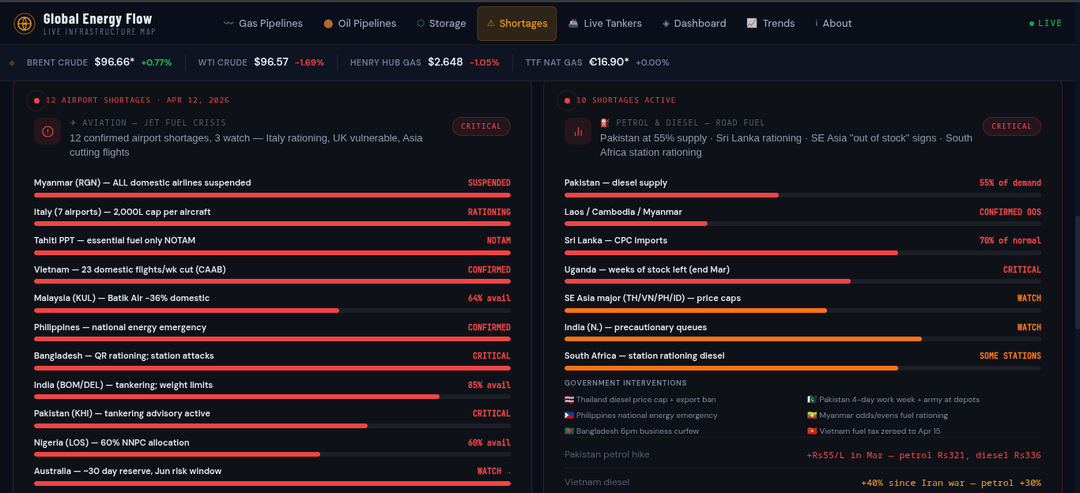
– **Jet Fuel**: Severe impacts hitting aviation hard. 17 active shortages affecting 12 countries. Prices surged dramatically (e.g., Asia +132%, Europe +121%). Rationing at airports in Italy (7 airports limiting to 2,000L per aircraft), flight cuts in Vietnam (10-50%), national energy emergency in the Philippines, and suspensions in Pakistan. Over 7,000 flights cancelled globally on April 6 alone. European airports warn of systemic shortages within weeks if flows don't resume. [](grok_render_citation_card_json={"cardIds":["67a626"]})
– **Petrol & Diesel**: Widespread road fuel issues. Pakistan at ~55% supply with major price hikes and rationing. SE Asia seeing empty stations (Laos, Cambodia, Myanmar), export bans in Thailand, and curfews/business restrictions in Bangladesh. South Africa and others implementing station-level rationing.
– **Heating Oil**: Elevated risks in Central Europe due to the Druzhba pipeline outage (74 days offline). Countries like Hungary and Slovakia drawing emergency stocks at 3x the normal cost.
– **Broader Context**: 17 active shortages trace largely to the Hormuz chokepoint (Day 49 as of April 11) and pipeline attacks. Brent crude hovering around $96–119 recently with a war premium. EU gas storage at just 29% (well below average), and cascading effects on supply chains.
The dashboard includes:
– Interactive maps of tankers, pipelines (265+ oil, 281+ gas), and storage facilities
– Live price trackers across 147 countries
– Gauges for storage levels (e.g., US SPR at ~50% capacity)
– Tables of active disruptions and anchorage alerts
Data sources include MarineTraffic (AIS), EIA, IEA, GIE, and operator reports. All visualizations are built for clarity and real-time monitoring.
This shows how interconnected global energy flows are — a disruption upstream quickly ripples into consumer-level shortages and economic impacts.
by SashSail
1 Comment
Explore the full interactive page here:
[https://global-energy-flow.com/#shortages/data](https://global-energy-flow.com/#shortages/data)