Can you do this without the x axis changing scale?
ElectricPotatoStar on
So… what happened to make it artificially decrease between 2016 and 2018? That needs to be adjusted.
Something is off. Maybe it’s the scale, or who was included in the ACS or something.
rjewell40 on
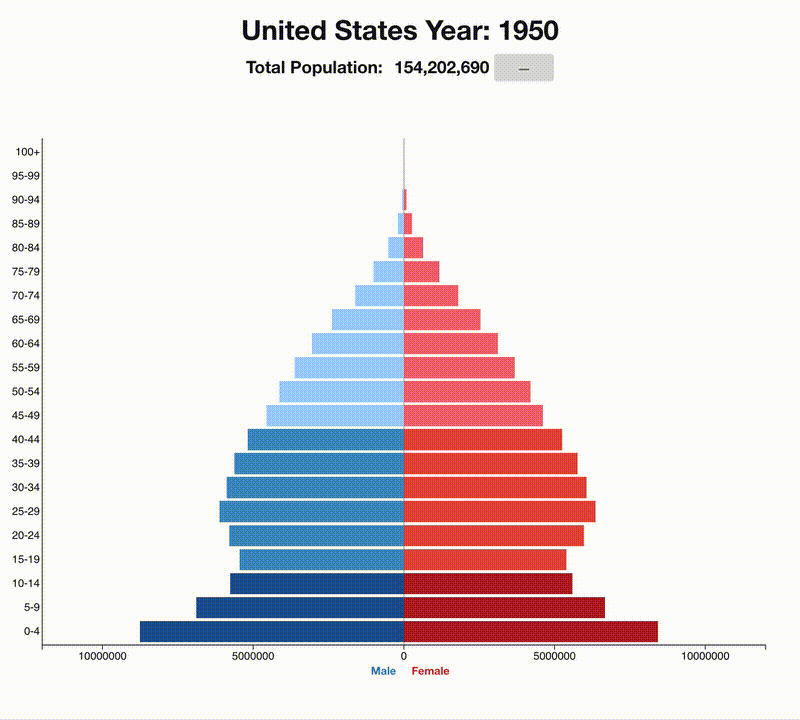
Wow!!! You can see the boomers.
Loki-L on
The Baby bommers moving through the population like a snake that has eaten a rabbit.
ChrisGari on
Boomers are hoarding all the wealth
meltedbananas on
It was Cartman around 1996ish.
Noppers on
Changing the x-axis scale partway through really impedes the usefulness of the graph
Thunderdrake3 on
Remember, a flared base is essential for keeping your population safe.
Xyrus2000 on
The US has a native birth replacement rate of 1.6, and 2025 was the first year we had a net negative immigration. I don’t see how they’re getting positive growth for 2025, let alone 2026.
We won’t know for certain until the next census, but the first year of our official population decline is very likely to be 2025.
lupin_bebop on
The scale should not have changed on this. That was very off putting.
It also made the math look like it wasn’t adding up. Also, knowing how generations age, that didn’t look right through the years.
Especially between 2014 to 2018. There seemed to be a *decrease* in population? It may have just been the scale change again, which was again off putting.
As someone who was eligible to vote in 2006, those age demographic numbers look off to me.
fredinNH on
That doesn’t seem as bad as I’d have thought. Plenty of people coming up to pay social security for Gen X. I still expect a cut in the benefit at some point but it’s not as doomsday as many seem to think.
Lmoorefudd on
From butt plug to weird cruise ship.
AdventureMan247 on
The effects of immigration in this animated graphic are obvious stating in the ‘00’s
vivalatoucan on
It’s interesting for how many years the pop increased by a similar amount around 3 mil
casullivan0704 on
Born in 1965. I was behind the bubble…. The boom came through and reamed out the services in school. The 6th grade trip field trip canceled when I was in 4th grade, the middle school trip to cedar point amusement park cancel the year before we could go, the senior trip to DC a 25 year tradition cancel the year I entered high school.
It continued in the work place with pensions getting killed, no vacation but pto, etc.
willmaineskier on
This is why people complain that young people don’t want to work. Throughout my childhood there were more young people at each younger bracket, now there are fewer. There just are not the proportion of young to old as had existed for many generations.

19 Comments
Абсолютно здоровая пирамида 👍
Absolutely healthy rectangle
Can you do this without the x axis changing scale?
So… what happened to make it artificially decrease between 2016 and 2018? That needs to be adjusted.
Something is off. Maybe it’s the scale, or who was included in the ACS or something.
Wow!!! You can see the boomers.
The Baby bommers moving through the population like a snake that has eaten a rabbit.
Boomers are hoarding all the wealth
It was Cartman around 1996ish.
Changing the x-axis scale partway through really impedes the usefulness of the graph
Remember, a flared base is essential for keeping your population safe.
The US has a native birth replacement rate of 1.6, and 2025 was the first year we had a net negative immigration. I don’t see how they’re getting positive growth for 2025, let alone 2026.
We won’t know for certain until the next census, but the first year of our official population decline is very likely to be 2025.
The scale should not have changed on this. That was very off putting.
It also made the math look like it wasn’t adding up. Also, knowing how generations age, that didn’t look right through the years.
Especially between 2014 to 2018. There seemed to be a *decrease* in population? It may have just been the scale change again, which was again off putting.
As someone who was eligible to vote in 2006, those age demographic numbers look off to me.
That doesn’t seem as bad as I’d have thought. Plenty of people coming up to pay social security for Gen X. I still expect a cut in the benefit at some point but it’s not as doomsday as many seem to think.
From butt plug to weird cruise ship.
The effects of immigration in this animated graphic are obvious stating in the ‘00’s
It’s interesting for how many years the pop increased by a similar amount around 3 mil
Born in 1965. I was behind the bubble…. The boom came through and reamed out the services in school. The 6th grade trip field trip canceled when I was in 4th grade, the middle school trip to cedar point amusement park cancel the year before we could go, the senior trip to DC a 25 year tradition cancel the year I entered high school.
It continued in the work place with pensions getting killed, no vacation but pto, etc.
This is why people complain that young people don’t want to work. Throughout my childhood there were more young people at each younger bracket, now there are fewer. There just are not the proportion of young to old as had existed for many generations.
[ Removed by Reddit ]