
Data used from the EPA's API that pulled the 5 target states (California, Texas, West Virginia, Colorado, and New York) as well as utilized the National Emission Inventory source type (Onroad, process, and point).
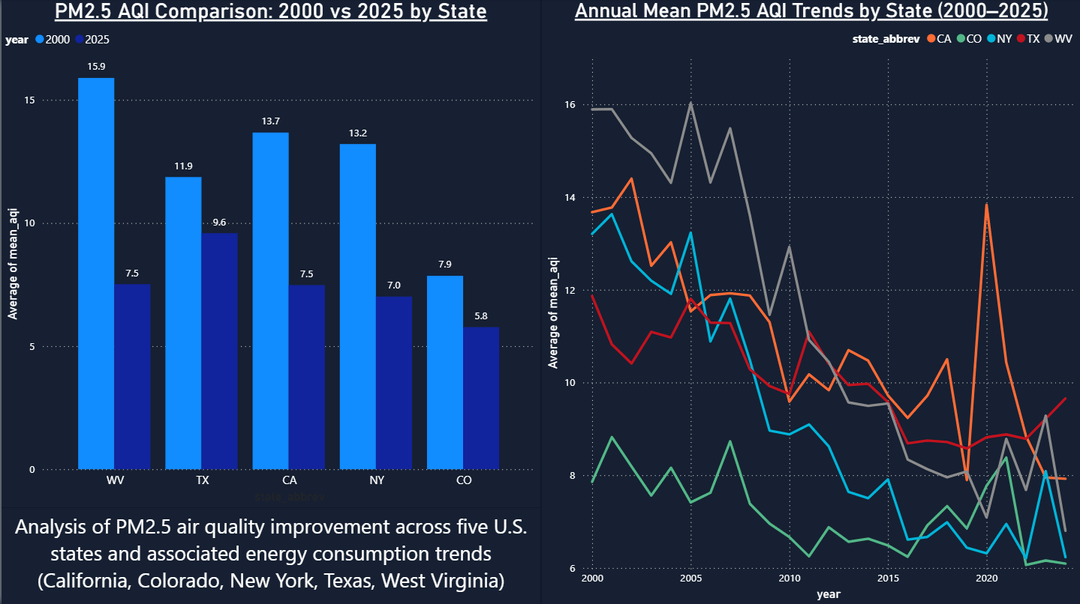
1st Page – shows the mean Air Quality Index of the 5 states and the overall decrease from 2000 to 2025.
Notable spikes –
California's 2020 wildfires affected the overall AQI and surrounding states as well.
New York in 2023 was affected by the Canadian wildfire smoke
At this time of the latest data pull, Texas is now on the rise again in mean AQI as of 2022
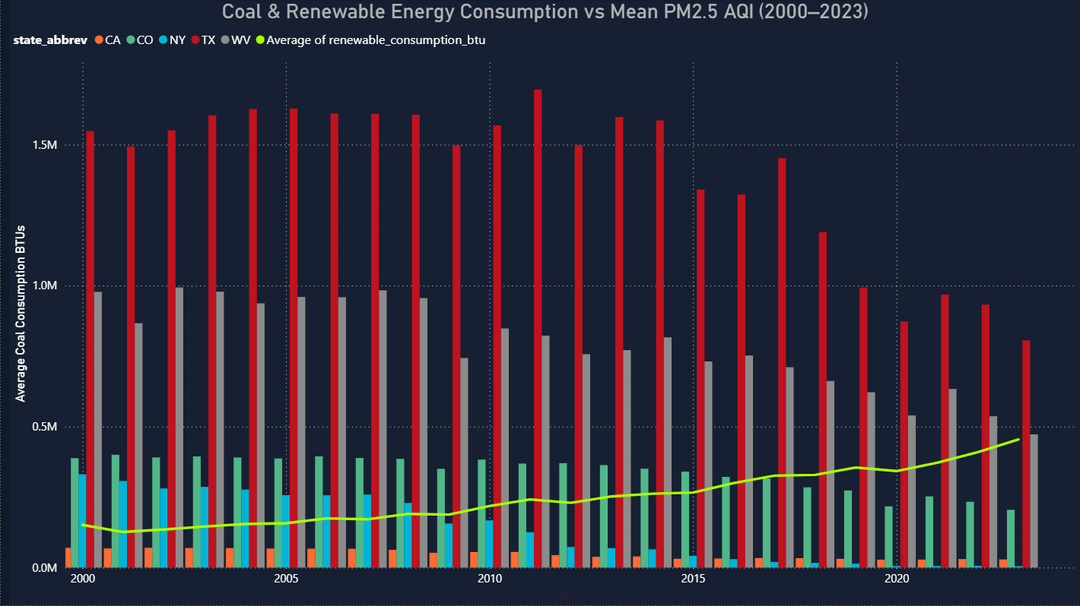
2nd page -Shows overall average coal consumption in BTUs across the 2000-2025 timeline. The trend line is overall increase per year for the 5 states in renewable consumption/usage in BTUs as well
by rover295
2 Comments
Totally unsurprising. A good result to have in the record books, nonetheless.
Nice. I live in a cold climate, solar panels don’t pay off for 15 years at today’s numbers which means they won’t pay off.
But if you have the funds to make a better environment or live in warmer climates buy more solar panels.