
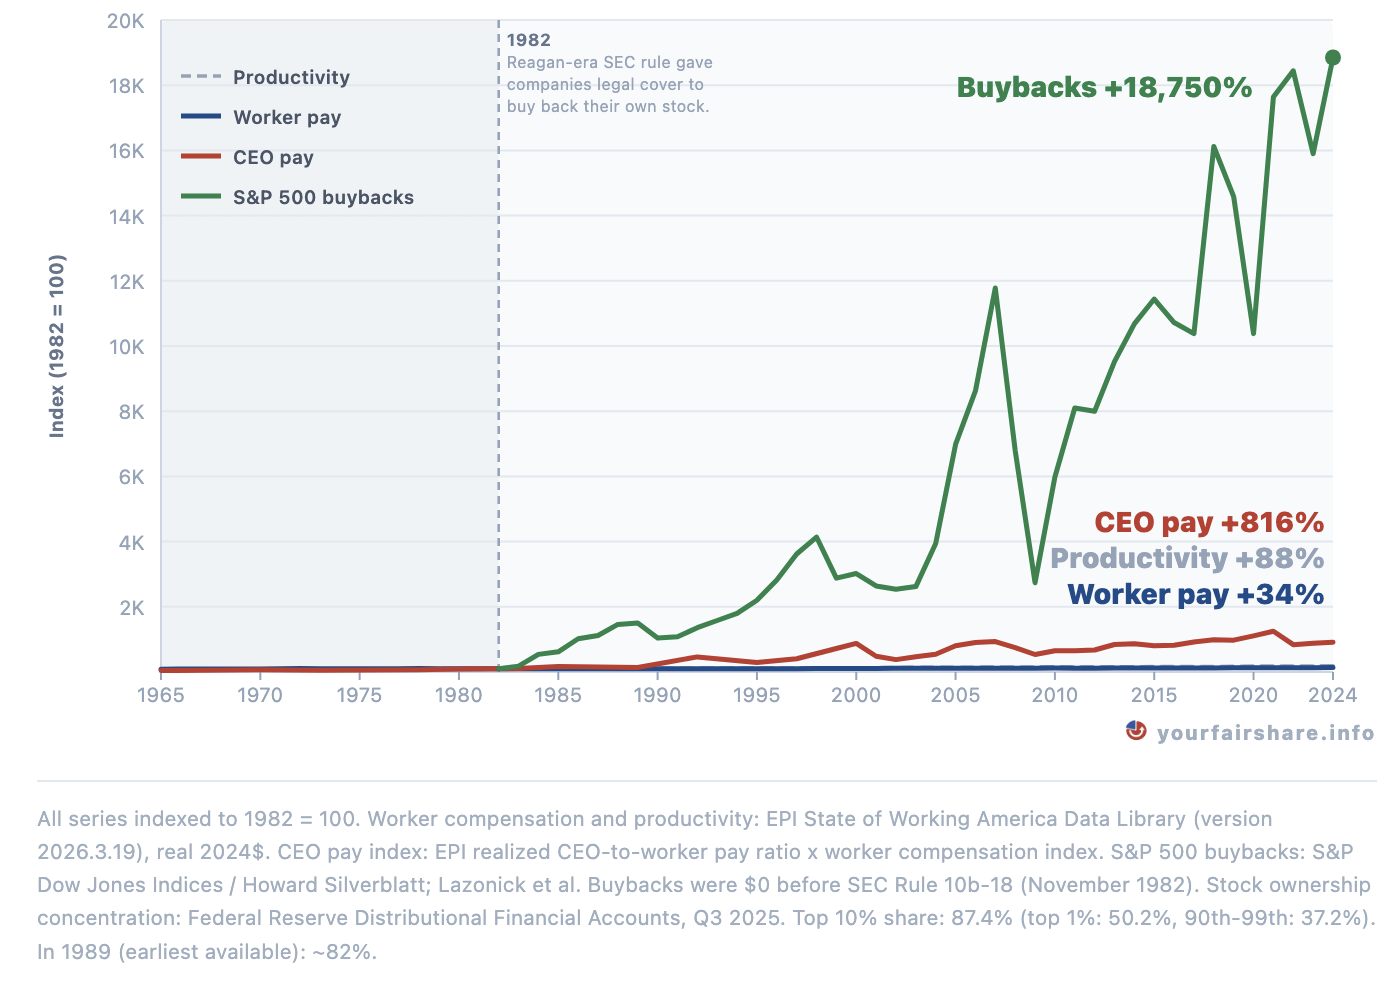
Linear scale, not log. Deliberate choice: a log scale makes all four series look comparable in magnitude. On a linear scale you see the actual ratio. Worker pay and CEO pay (+34% and +816%) are visible as separate lines near the baseline. All four series rebased to 1982 = 100. 1982 is when the SEC issued Rule 10b-18, creating a safe harbor for corporate share buybacks. Before that rule, buybacks carried legal risk and were effectively zero.
by IESAI_lets_go
5 Comments
If buybacks basically didn’t exist before 1982 and all shareholder capital was returned via dividends, I don’t see how a buyback line adds any useful information.
This leaves out dividends. I would expect dividends to be reduced by about the same percentage of profits.
This graph is garbage anyway. It uses a % increase from when a practice was effectively banned. So the starting amout was neat zero so any increase in percentage terms would be astronomical.
So basically screw companies how dare they make us pay higher prices. /s
Buybacks are effectively a form of dividend, and should be grouped with dividends for the graph to make any sense
So productivity is just a vertical line in 1982??? Someone tell me I’m blind please, reading the key I’m not convinced I’m not having an aneryism.